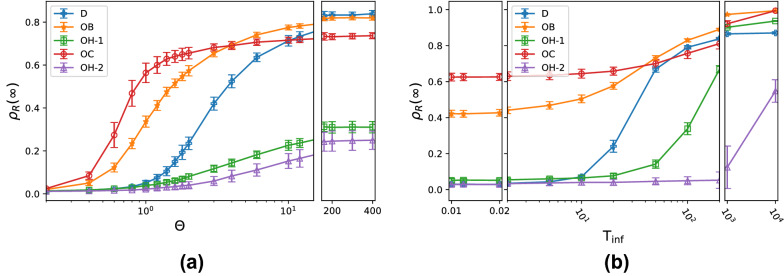
Figure 3.
Effectiveness of the epidemic outbreak as a function of the contagion parameters for the five collective states identified in Fig. 1: Disordered (D), ordered with bands (OB), ordered with clusters (OC), and two ordered homogeneous states (OH-1 and OH-2). Each panel presents the fraction of agents that were infected and later recovered during the epidemic outbreak as a function of either the infection-lifetime transmissibility with fixed (a) or of the mean agent infection duration with fixed (b). Each point shows the mean value for 50 simulations and the error bars, its standard deviation.

