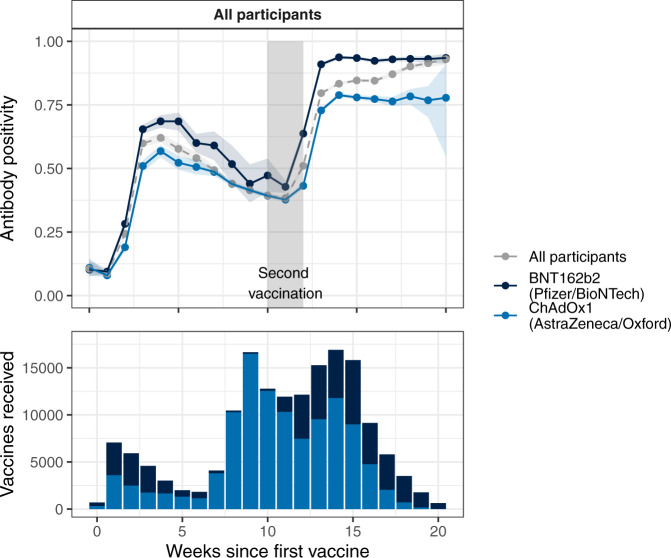
Fig. 1. Vaccine response (upper panel) and uptake (lower panel) over time.
Participants are grouped by weeks since first and second vaccination, and secondarily by vaccine received. The proportion of tests reported as positive (antibody positivity) within group by week is shown. Participants who had received either (i) a single dose but no second dose, or (ii) two doses of the vaccine between 10 and 12 weeks after the first were included in the plot. Shaded areas on either side of the plot lines denote 95% confidence intervals; the grey shaded block denotes the 10–12 week period after first vaccination. The upward trend post-second-dose observed in the all participants line is attributable to the changing proportions of ChAdOx1vs BNT162b2 vaccine after 17 weeks.

