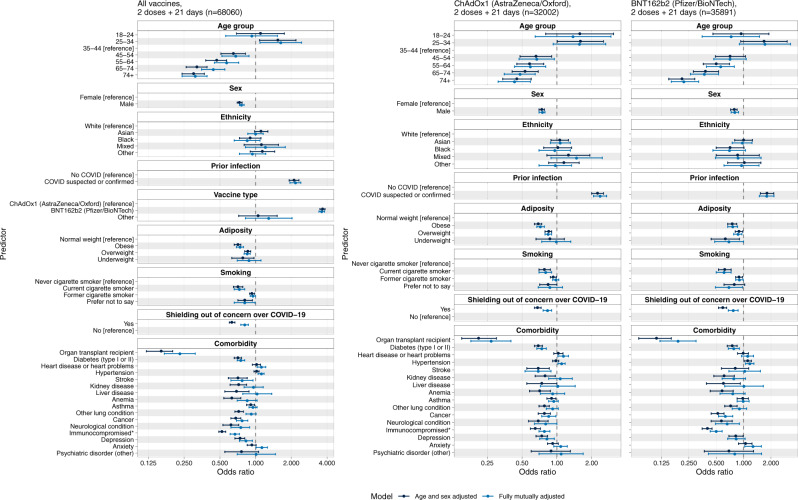
Fig. 2. Forest plot showing odds ratios and 95% confidence intervals for antibody positivity (yes/no) versus biological and behavioural covariates in logistic regression models, among 68,060 respondents who had received two vaccine doses with the second dose at least 21 days prior.
Dark blue CIs indicate models adjusted on age and sex only; light blue CIs indicate models adjusted on age, sex, ethnicity, adiposity, vaccine type (in the right panels only), prior infection, shielding status, comorbidities and smoking status.

