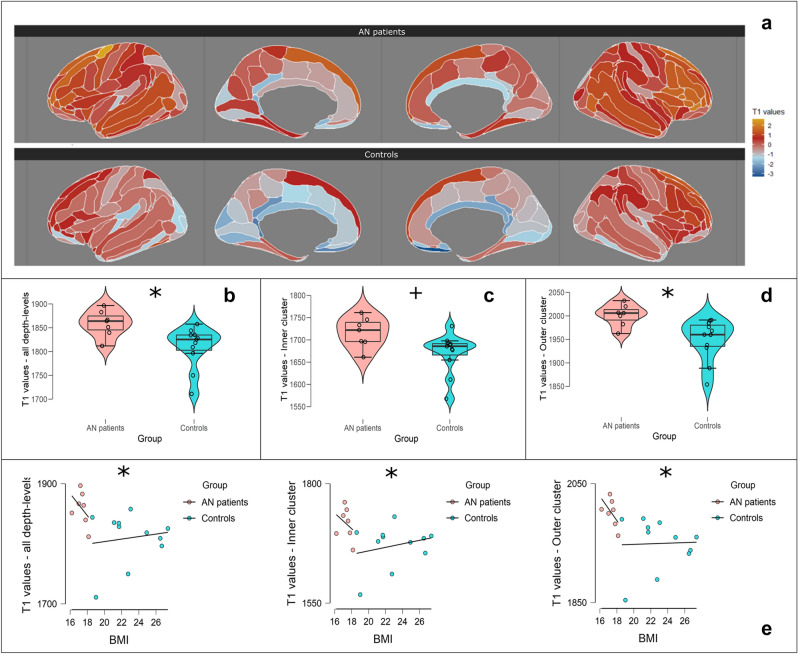
Figure 1.
(a) Standardized total T1 values map for AN patients (top) and controls (bottom). Maps are based on the Destrieux’s Atlas and show T1 values’ average across 10 depth-levels per each Region-of-Interest (ROI) in AN patients and healthy controls. For illustrative purposes, the distribution of T1 values was rescaled to a distribution with mean = 0. (b) Boxplot with violin and jitter elements displaying distribution of T1 values (in ms) as intracortical myelin concentration index averaged across all 10 cortical depth-levels for AN patients and controls; (c) boxplot with violin and jitter elements displaying distribution of inner cluster’s T1 values (in ms) for AN patients and controls; (d) boxplot with violin and jitter elements displaying distribution of outer cluster’s T1 values (in ms) for AN patients and controls; (e) scatterplots between BMI and T1 values (in ms) in all depth-levels, inner and outer clusters in AN patients and controls. For illustrative purposes groups are shown separately, although the statistical significance symbol refers to the analysis on overall population. T1 values distributions between AN patients and controls and relationship between T1 values and BMI. *p < 0.05; +p = 0.05.

