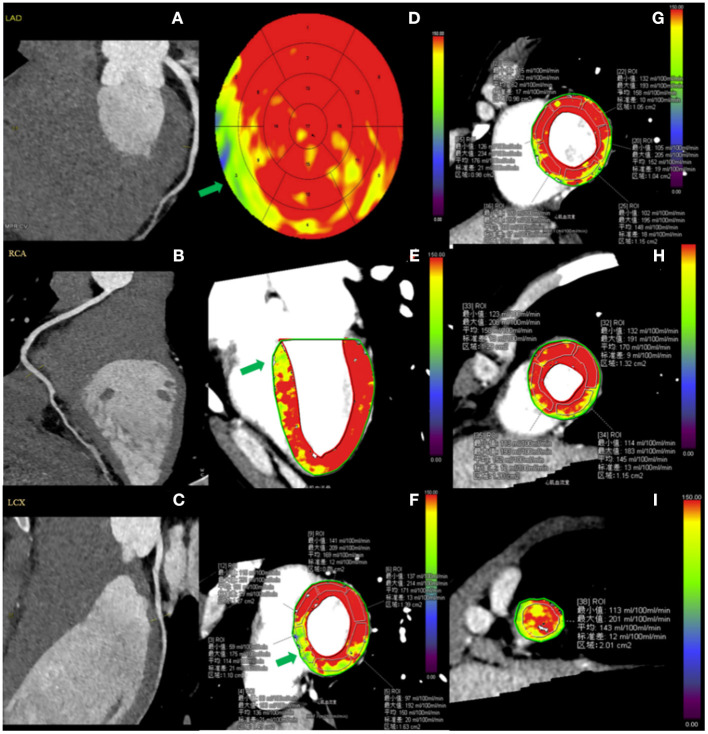
Figure 2.
Case example of CCTA and hyperemic MBF distribution in a healthy participant. A 29-year-old male healthy volunteer. (A–C) Resting CCTA shows no calcified plaque or stenosis in the coronary arteries. (D–I) Stress CT-MPI during adenosine infusion showed normal myocardial perfusion, as shown by relatively homogeneous color-coded images in the bull's eye diagram (D) and left ventricular long-axis view (E) and short-axis views (F–I). (D–F) The green arrow shows that the hyperemic MBF of basal-septum was lower than that of other segments. (F,G) ROI was manually placed in each myocardial segment as large as possible, excluding a 1 mm endocardial and epicardial borders to avoid image artifacts. CCTA, coronary computed tomography angiography; CT-MPI, computed tomography myocardial perfusion imaging; MBF, myocardial blood flow; ROI, Region of interest.

