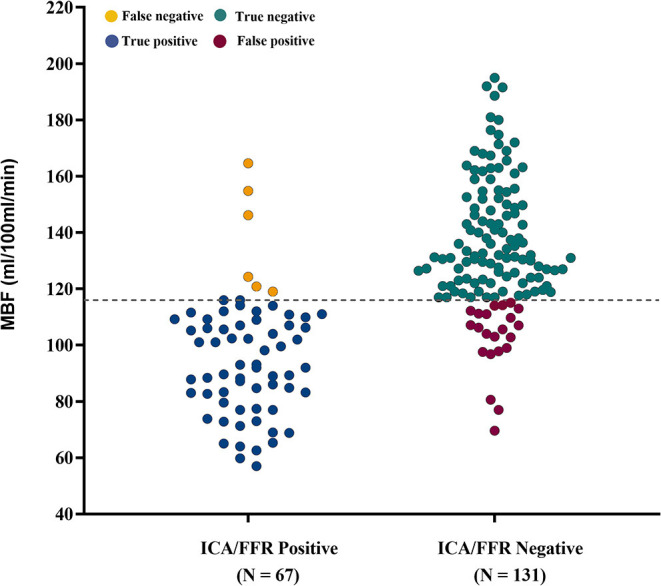
Figure 5.

Diagnostic classification by CT-MPI and ICA/FFR. Scatter dot plot of all observations in per-vessel analysis. Gray dashed line represents the cutoff value of MBF of 116 ml/100 ml/min. Yellow dots represent false negatives (n = 6), blue dots represent true positives (n = 61), green dots represent true negatives (n = 109), and red dots represent false positives (n = 22). FFR, fractional flow reserve; ICA, invasive coronary angiography; MBF, myocardial blood flow.
