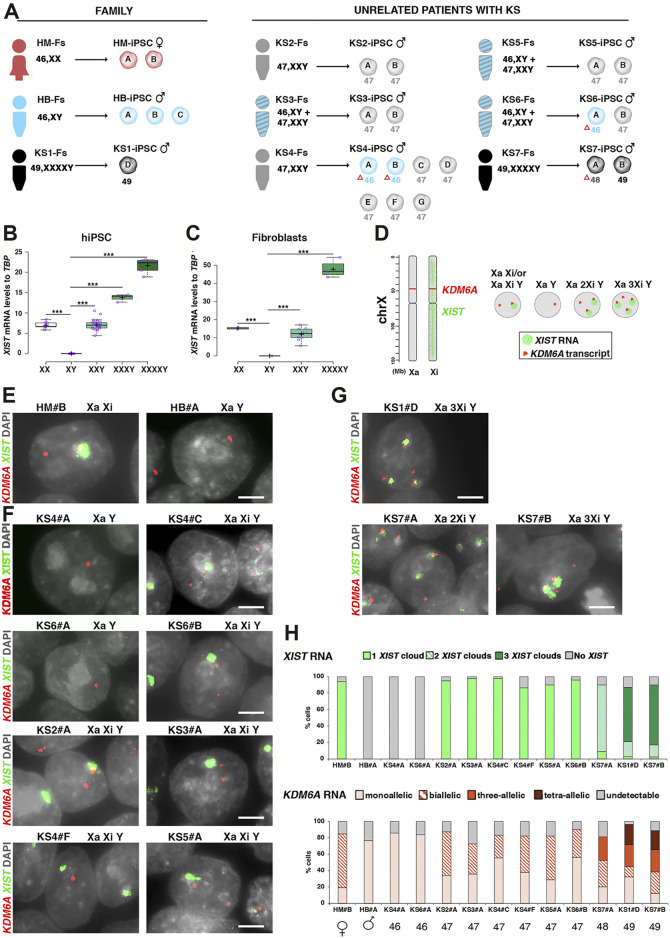
FIGURE 1.
Patient cohort description and XIST dosage validation. (A) Cohort of recruited patients with KS and HGA, including fibroblasts and independent hiPSC clones derived from each patient and healthy controls. Each karyotype is specified by color: red, healthy mother; blue, healthy brother and isogenic 46,XY; black, 49,XXXXY and 48,XXXY; gray, non-mosaic 47,XXY; blue with gray stripes, mosaic 47/46,KS. The red triangle (Δ) indicates spontaneous X chromosome loss during reprogramming or naturally isogenic lines. (B) Box plot showing XIST expression in hiPSCs (C) and fibroblasts for the indicated karyotypes measured by Taqman quantitative polymerase chain reaction (q-PCR). Each purple dot represents a q-PCR expression analysis from at least three (hiPSCs) and two (fibroblasts) independent experiments. Each biological replicate is defined as an independent RNA sample obtained at consecutive passages from the same iPSC clone or from independent iPSC clones with the same karyotype. Centerlines show the medians; box limits indicate the 25th and 75th percentile. Whiskers extend 1.5 times the interquartile range from the 25th and 75th percentiles. In (B) n = 9, 9, 36, 3, and 6 sample points; in (C) n = 2, 2, 10, and 4 sample points. Student’s t-test, *p < 0.05; **p < 0.01, and ***p < 0.001. (D–H) Characterization of X chromosome inactivation (XCI) in KS- and HGA-iPSCs by RNA-FISH. (D) Schematic showing the localization of XIST and KDM6A genes on the X chromosome and XIST RNA coating (left). Model for XCI in euploid and aneuploid KS and HGA cells (right). (E–G) Representative RNA-FISH images of XIST-mediated X chromosome silencing (green) and KDM6A (red) mono-, bi-, tri-, and tetra-allelic expression in healthy iPSCs and in KS- and HGA-iPSCs. DNA was stained with DAPI (gray). Scale bar = 50 µm. (H) Percentage of XIST clouds and KDM6A signals counted in approximately 600 nuclei for the indicated iPSC lines.

