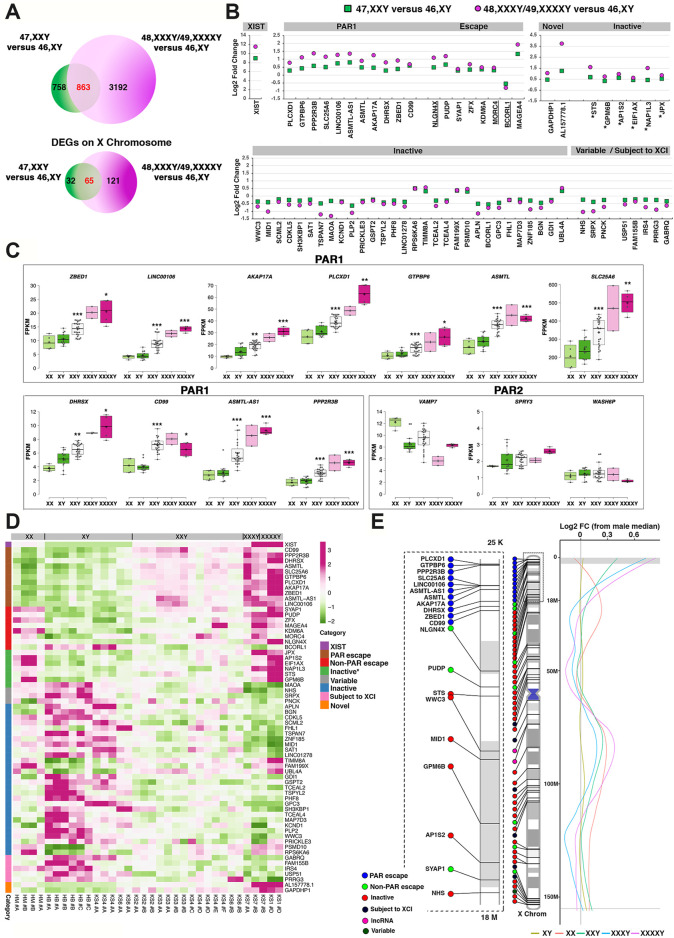
FIGURE 3.
Transcriptomic profiling of KS- and HGA-iPSCs identifies proportional and inversely proportional X chromosome dosage-dependency of X-linked genes. (A) DEGs number and distribution across the comparisons 47, KS versus 46, XY and 48/49,XXXY/XXXXY versus 46, XY in the global transcriptome (upper Venn) or in the X chromosome (lower Venn). (B) Log2 fold change of shared dosage-sensitive X-linked DEGs. Six groups of DEGs are shown: genes from the PAR1 region, biallelic genes escaping Xi (Escape), monoallelic genes expressed from the active X (Inactive), and genes whose Xa/Xi status has never been described (Novel). Inactive DEGs labeled with asterisks have been previously described as escape genes. Variable and subject to XCI categories were assigned accordingly to previous studies. Underlined DEGs were previously described as inactive or variable (Tukiainen et al., 2017). (C) Boxplots showing the X dosage-dependent FPKM expression of genes from PAR1 and PAR2 regions. The significance between the comparison XXY (n = 24) versus XY (n = 13) and XXXXY (n = 4) versus XY (n = 13) was calculated using the two tailed Student’s t-test, *p < 0.05; **p < 0.01; ***p < 0.001. The significance for the comparison 48, XXXY (n = 2) versus 46, XY was not evaluated. (D) Heatmap showing the proportional and inversely proportional FPKM expression of shared X chromosome dosage-sensitive DEGs across the two comparisons, in PAR1, non-PAR escape, inactive, and novel categories in each RNA-Seq sample. Inactive DEGs marked with an asterisk have been previously described as Escape genes. DEGs were defined as variable and subject to XCI categories, according to previous studies (Tukiainen et al., 2017). (E) Left: Ideogram showing the position along the X chromosome of upregulated DEGs from the two comparisons in (A) included in the indicated categories, according to their Xa/Xi status. The dotted rectangle shows the magnified Xp chromosome area from 25 Kb to 18M. Right: Moving average line plot (loess fit, span = 0.45) along the X showing the log2 fold change (FC) from a control male. Gray horizontal boxes represent PAR1 and PAR2 limits. The gray vertical line represents no theoretical deviations from the control male.

