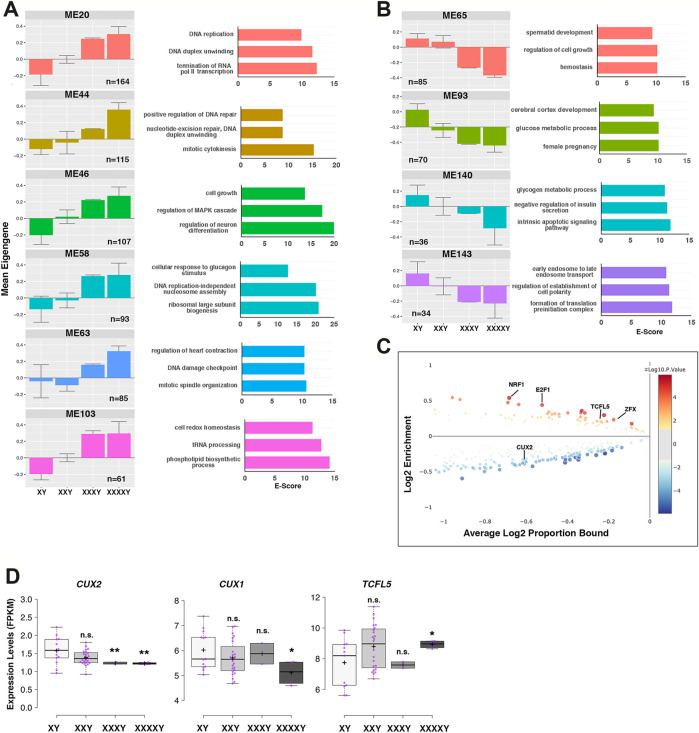
FIGURE 6.
WGCNA of the effects of sex chromosome dosage on the global transcriptome. (A) Histogram plots showing the mean expression (±95% confidence) by genotype for six selected proportional X chromosome dosage-dependent gene co-expression modules (left) and enrichment scores (E scores) of the top three Gene Ontology (GO) terms (right) for each of the ten selected supermodules. (B) Histogram plots showing the median expression (±95% confidence) by genotype for four inversely proportional X chromosome dosage-dependent gene co-expression modules (left) and enrichment scores (E scores) of the top three GO terms for each module (right). (C) CiiiDER enrichment analysis showing the transcription factor binding sites (TFBSs) that are significantly over-represented (greater than zero) and under-represented (less than zero) for the supermodule ME48 compared with the background sequences. The plot shows the proportion of regions bound for each TF. The y-axis shows the enrichment (ratio of proportion bound) and the x-axis shows the average log proportion bound. The sizes and colors of the circles indicate the ±log10(p value). (D) FPKM expression values of CUX1, CUX2 and TCFL5 TFs in iPSCs in the indicated karyotypes. Each purple dot represents an RNA-Seq replicate. Centerlines show the medians; box limits indicate the 25th and 75th percentiles.

