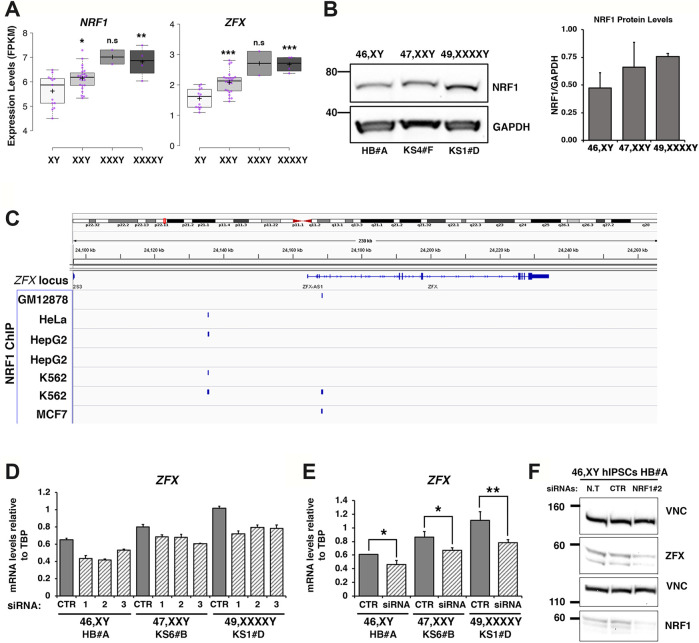
FIGURE 7.
The X dosage-sensitive autosomal TF NRF1 regulates ZFX transcriptional levels. (A) FPKM expression values of NRF1 and ZFX TFs in iPSCs in the indicated karyotypes. Each purple dot represents an independent biological RNA-Seq sample. Centerlines show the medians; box limits indicate the 25th and 75th percentile. The significance between the comparison XXY (n = 24) versus XY (n = 13) and XXXXY (n = 4) versus XY (n = 13) was calculated using the two tailed Student’s t-test, *p < 0.05; **p < 0.01; ***p < 0.001. (B) Lysates from 46, XY (HB#A), 47, XXY (KS4#F), and 49, XXXXY (KS1#D) iPSCs were immunoblotted with the indicated antibodies. Quantification of NRF1 protein levels relative to GAPDH expression was performed using ImageJ (right panel). Error bars are ± standard deviations of two independent experiments. (C) NRF1 ChIP-Seq tracks showing the localization of NRF1 at the ZFX locus. NRF1 peaks within -30 Kb and +10 Kb from the ZFX gene body are shown (blue rectangles). The ChIP-Seq tracks were downloaded from the ENCODE portal (https://www.encodeproject.org/) with the following identifiers: ENCFF931XAL, ENCFF002CSW, ENCFF003GNY, ENCFF972NIR, ENCFF144PPR, ENCFF493ABN, ENCFF651PWG). (D) Graph showing the mRNA expression levels of ZFX measured for the indicated iPSC lines and genotypes transfected with a scramble siRNA (CTR) and three different siRNAs targeting NRF1 (siRNA 1, 2, and 3) (Supplementary Table S13). (E) Graph showing the average of two independent knockdown experiments performed on the indicated iPSCs lines transfected with either CTR or NRF1 siRNA number 2. Student’s t-tests, *p < 0.05; **p < 0.01; and ***p < 0.001. (F) Western Blot showing the down-regulation of NRF1 and ZFX proteins in a 46,XY iPSC line using a siRNA targeting NRF1 (siRNA number 2); Vinculin protein (VNC) was used as loading control. n.t., not transfected, CTR, scramble siRNA.

