Figure 1.
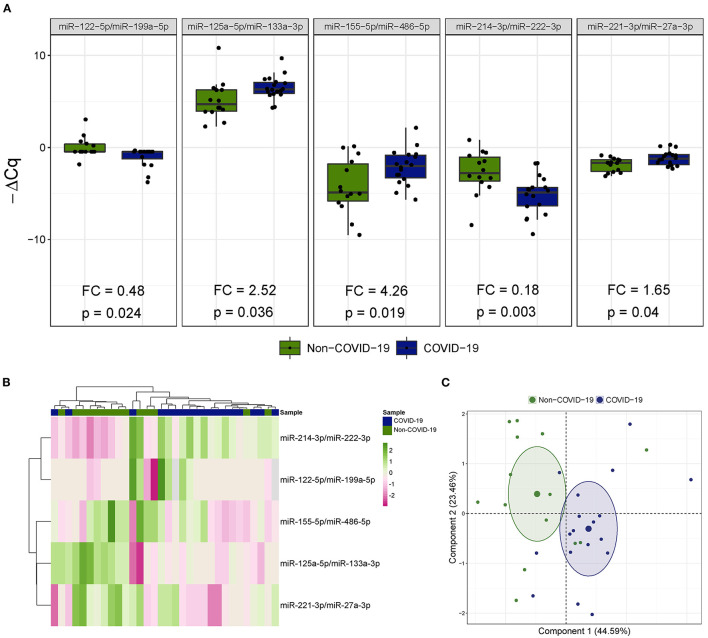
The microRNA ratio profile in bronchial aspirate samples from critically ill COVID-19 and non-COVID-19 patients. (A) Boxplot including those microRNA ratios that showed differences between critically ill COVID-19 and non-COVID-19 patients. Differences between groups were analyzed using linear models for arrays. P-values describe the significance level for each comparison; (B) Heatmap showing the unsupervised hierarchical clustering. Each column represents a patient (COVID-19 or non-COVID-19). Each row represents a microRNA. The patient clustering tree is shown on top. The microRNA ratio clustering tree is shown on the left. The color scale illustrates the relative expression level of microRNAs. Pink spectra represent increasing levels. Green spectra represent decreasing expression; (C) Principal component analysis. Each point represents a patient.

