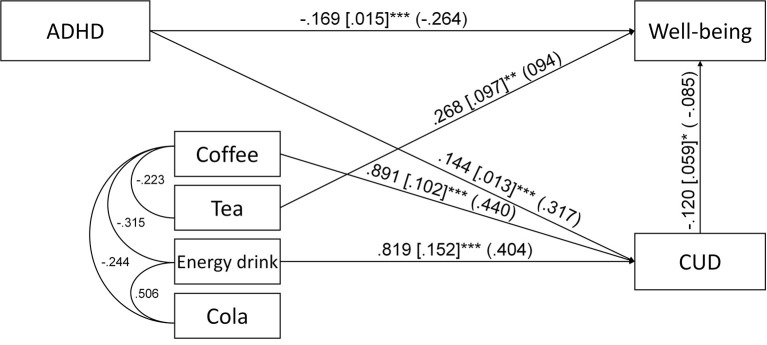
Figure 3.
Path analysis for the association of ADHD symptoms, coffee, tea, energy drink and cola consumption, caffeine use disorder symptoms (CUD) and well-being. Unstandardized regression coefficients, their standard errors (in brackets) and standardized coefficients (in parentheses) are presented in the figure. Only the significant (p < 0.05) direct paths and error covariances are presented *p < 0.05; **p < 0.01; ***p < 0.001.

