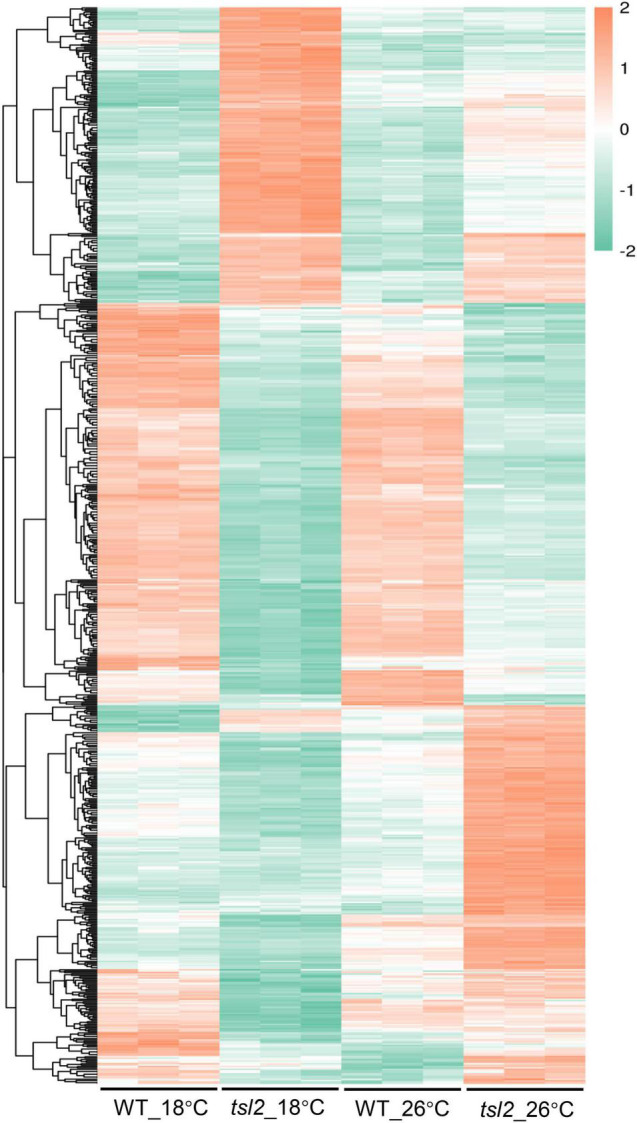
FIGURE 6.

Quantitative proteomic study identifies differentially expressed proteins between WT and tsl2 mutant plants. Each horizontal bar represents the level of an identified protein. Only those proteins with 1.3 ≤ FC or FC ≤ 0.7 (P ≤ 0.05) were used for heat map visualization.
