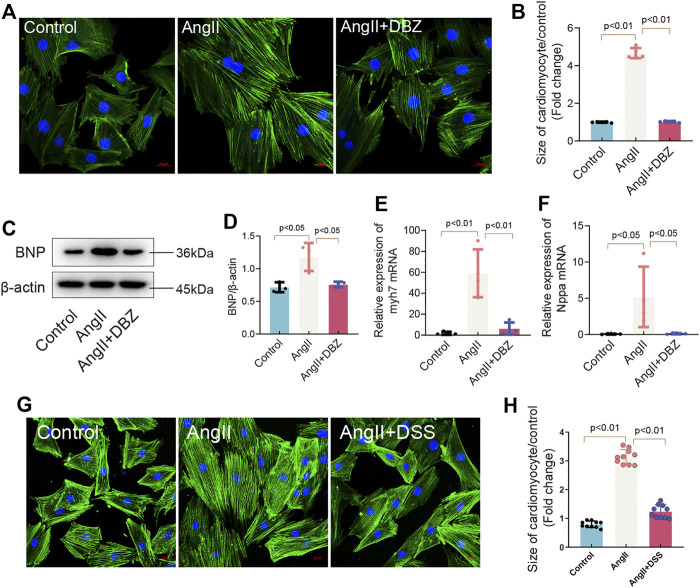
FIGURE 2.
DBZ inhibited cardiomyocyte hypertrophy. (A,B) Rhodamine phalloidin staining of NRCMs and quantification of the size of cardiomyocytes. Scale bars represent 20 μm. n = 10. (C,D) Representative Western blotting assay and quantification of BNP expression. n = 3. (E,F) Real-time PCR quantification of relative mRNA expression level of myh7 and Nppa. n = 4. (G,H) Rhodamine phalloidin staining of NRCMs and quantification of the size of cardiomyocytes. Scale bars represent 20 μm. n = 10. Results are expressed as means ± SD. Statistical analyses were performed by one-way ANOVA followed by Bonferroni’s post-hoc test.

