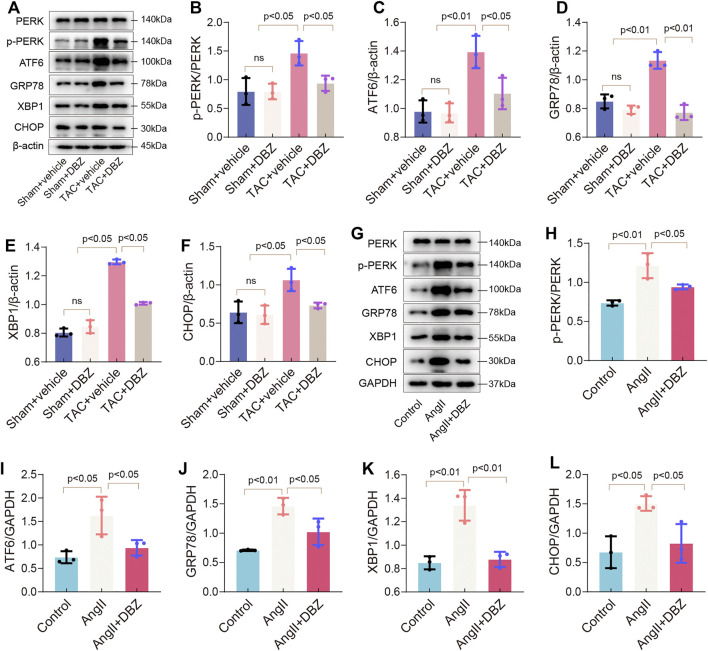
FIGURE 4.
DBZ attenuated ER stress. (A–F) Protein levels of PERK, p-PERK, GRP78, ATF6, CHOP, XBP1 were determined by Western blotting assay and quantified by densitometry. n = 3. (G–L) Protein levels of PERK, p-PERK, GRP78, ATF6, CHOP, XBP1 were determined by Western blotting assay and quantified by densitometry. n = 3. Results are expressed as means ± SD. Statistical analyses were performed by one-way ANOVA followed by Bonferroni’s post-hoc test.

