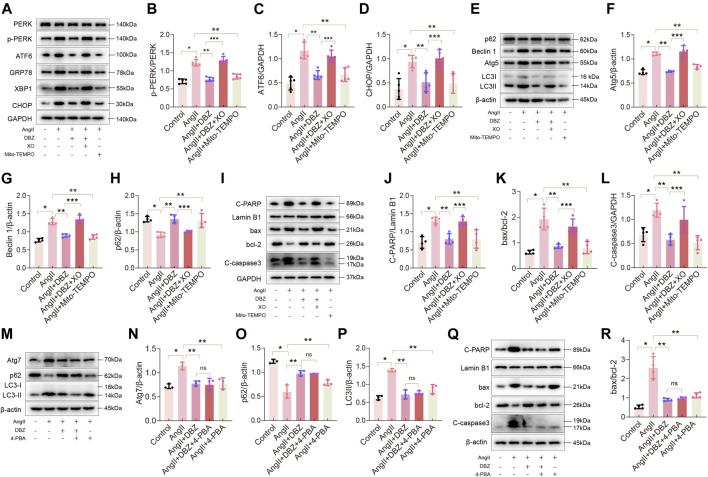
FIGURE 7.
Oxidative stress contributed to ER stress, autophagy and apoptosis. (A–D) Representative Western blotting assay and quantification of PERK, p-PERK, ATF6, CHOP, GRP78 and XBP1 expression. n = 4–5. (E–H) Representative Western blotting assay and quantification of Atg5, Beclin1, p62 and LC3 expression. n = 4. (I–L) Representative Western blotting assay and quantification of C-PARP, bax, bcl-2 and C-caspase3 expression. n = 4. (M–P) Representative Western blotting assay and quantification of Atg7, p62 and LC3 expression. n = 3. (Q–R) Representative Western blotting assay and quantification of C-PARP, bax, bcl-2 and C-caspase3 expression. n = 4. *p < .05 compared with the Control group, **p < .05 compared with the Ang II group, ***p < .05 compared with the Ang II + DBZ group. Results are expressed as means ± SD. Statistical analyses were performed by one-way ANOVA followed by Bonferroni’s post-hoc test.

