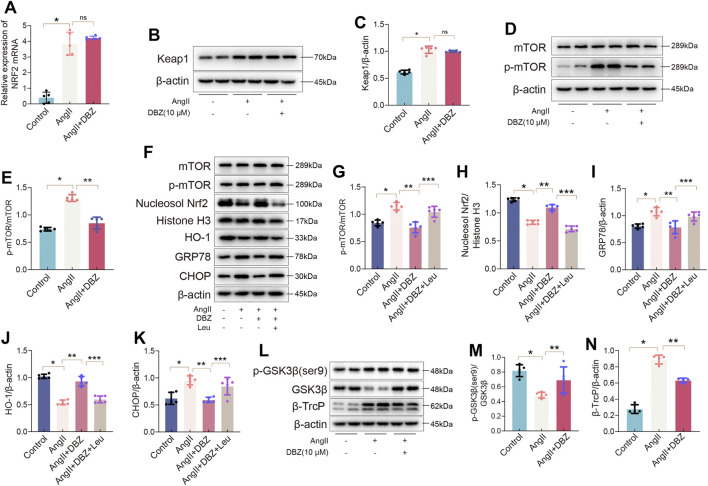
FIGURE 9.
DBZ inhibited the degradation of Nrf2 via the mTOR/β-TrcP pathway. (A) Real-time PCR quantification of relative mRNA expression level of Nrf2. n = 5. (B,C) Representative Western blotting assay and quantification of Keap1. n = 5. (D,E) Representative Western blotting assay and quantification of p-mTOR and mTOR. n = 5. (F–K) Representative Western blotting assay and quantification of mTOR, p-mTOR, nucleosol Nrf2, Histone H3, HO-1, GRP78, and CHOP expression. n = 5. (L–N) Representative Western blotting assay and quantification of p-GSK3β(ser9), GSK3β, and β-TrcP expression. n = 4. *p < .05 compared with the Control group, **p < .05 compared with the Ang II group, ***p < .05 compared with the Ang II + DBZ group. Results are expressed as means ± SD. Statistical analyses were performed by one-way ANOVA followed by Bonferroni’s post-hoc test.

