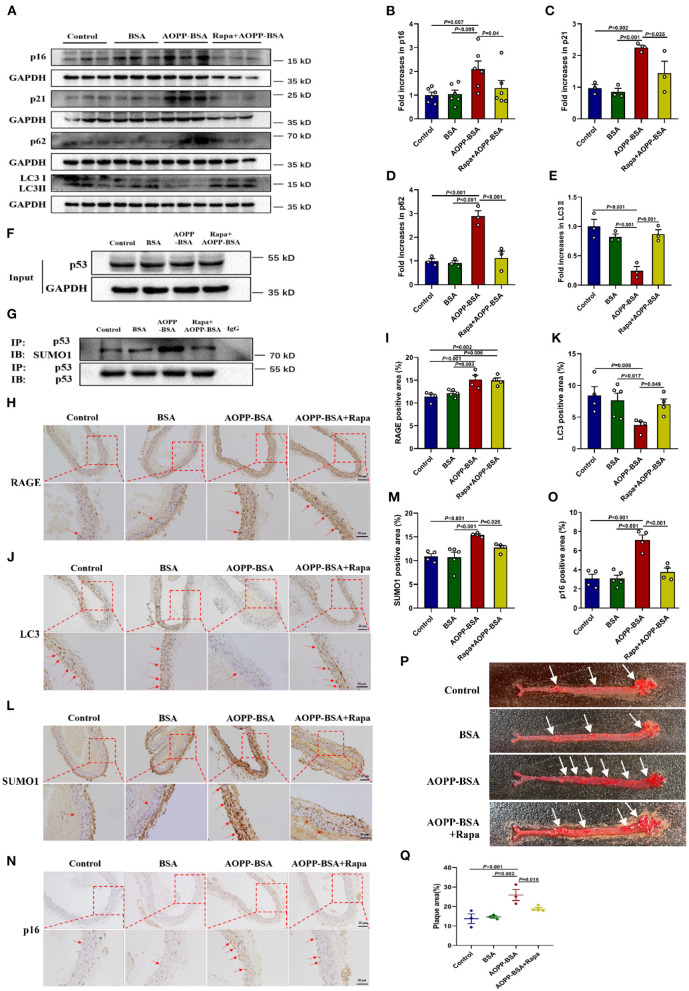
Figure 9.
AOPP-BSA promotes vascular senescence through vascular autophagy inhibition. ApoE−/− mice fed with high-fat diet were used to establish the model of vascular_senescence. Saline, BSA (50 mg/kg), AOPP-BSA (50 mg/kg), or AOPP-BSA (50 mg/kg) + Rapa (1 mg/kg) was injected intraperitoneally in 200 μl for consecutive 100 days or 200 days. (A) The expression of p16, p21, p62, and LC3II in aortic tissue were detected by western blot. GAPDH was used as loading control. (B–E) Quantification of p16 (n = 6), p21 (n = 3), p62 (n = 3), and LC3II (n = 3) protein expression. (F,G) Immunoprecipitation was used for p53 purification, and the levels of p53 and p53 SUMOylation in aortic tissue were detected by western blot. (H,J,L,N) Aortas isolated from mice in different groups were fixed and immunostained with RAGE, LC3, SUMO1 and p16. Images were photographed with Zeiss Imager Z2 microscope (Zeiss, Germany) and analyzed by Image J software. Representative images were showed and red arrows indicated the aortic endothelium. Scale bar for upper panel = 20 μm, scale bar for lower panel = 50 μm. (I,K,M,O) Quantification of RAGE, LC3, SUMO1 and p16 positive area in aortic tissue (n = 4 in Control group, n = 5 in BSA group, n = 4 in AOPP-BSA group, n = 4 in AOPP-BSA+Rapa group). (P) The aortic plaque area of high-fat-fed ApoE−/− mice was revealed by Oil Red O staining and analyzed by Image-Pro Plus Software. Representative images were showed. (Q) Quantification of plaque area in aortic tissue (n = 3 in Control group, n = 3 in BSA group, n = 3 in AOPP-BSA group, n = 4 in AOPP-BSA+Rapa group). One-way ANOVA with LSD or Dunnett's T3 post-hoc multiple comparisons was used for statistical analysis. All data are shown as mean ± SEM.

