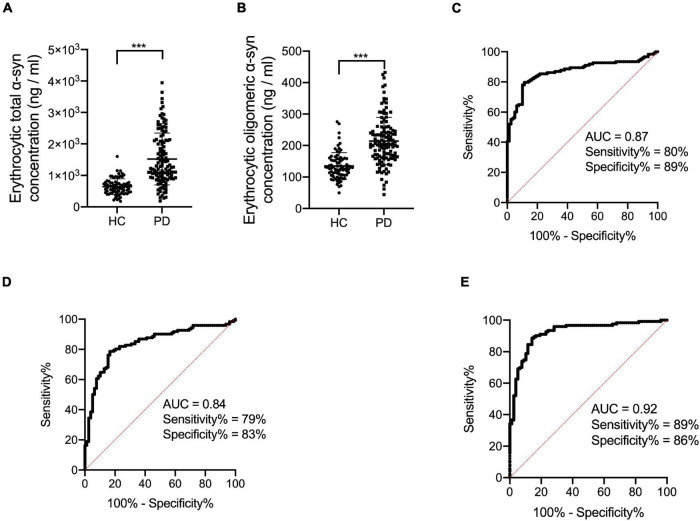
FIGURE 1.
Evaluation of erythrocytic total and oligomeric α-syn concentrations and the receiver operating characteristic curves for erythrocytic α-syn species and an integrative model to differentiate PD from HC. (A) Assessment of erythrocytic total α-syn levels. ***p < 0.001. (B) Assessment of erythrocytic oligomeric α-syn levels. ***p < 0.001. (C) Receiver operating characteristic curve for erythrocytic total α-syn adjusted for age and sex to differentiate PD from HC. (D) Receiver operating characteristic curve for erythrocytic oligomeric α-syn adjusted for age and sex to differentiate PD from HC. (E) Receiver operating characteristic curve for the multivariable model to differentiate PD from HC. The multivariable model includes erythrocytic total α-syn and erythrocytic oligomeric α-syn levels, controlling for age and sex. Univariate general linear model with the controlling of age and sex was used for two factor comparisons. HC, healthy control; PD, Parkinson’s disease; AUC, area under curve; α-syn, α-synuclein.

