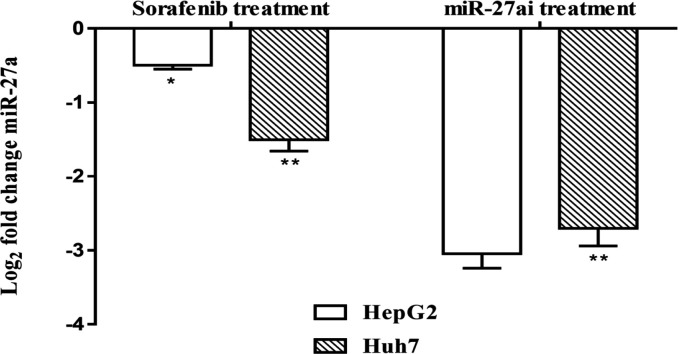
Figure 3.
Gene Expression Analysis of miR-27a Using qRT-PCR Assay in Hepatocellular Carcinoma Cells, HepG2 and Huh7, after Treatment with Sorafenib or miR-27a Inhibitor Compared with Control Untreated Cells. Data were represented as mean values± SD for three independent experiments. The statistical significance of the results was analyzed using the two-tailed Student’s t test (* p≤ 0.05, ** p ≤ 0.01)

