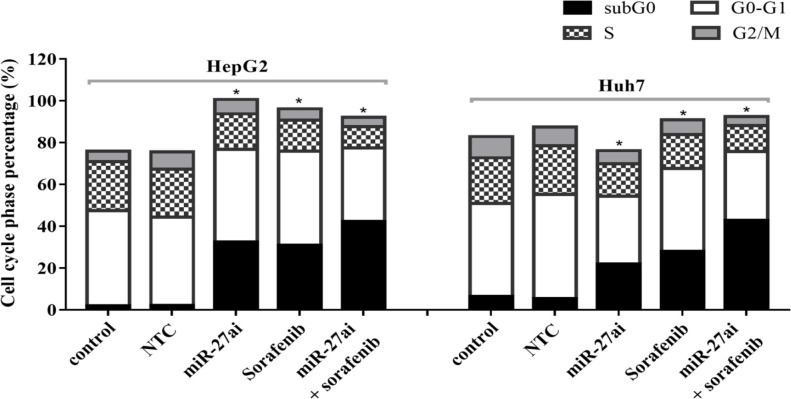
Figure 4.
Flow Cytometry of Cell Cycle Analysis in HepG2 and Huh7 Cell Lines Using PI Staining. The percentage of each cell cycle for both cells lines in different treated groups was represented. The statistical significance of the results was analyzed using the two-tailed Student’s t test (* p≤ 0.05).

