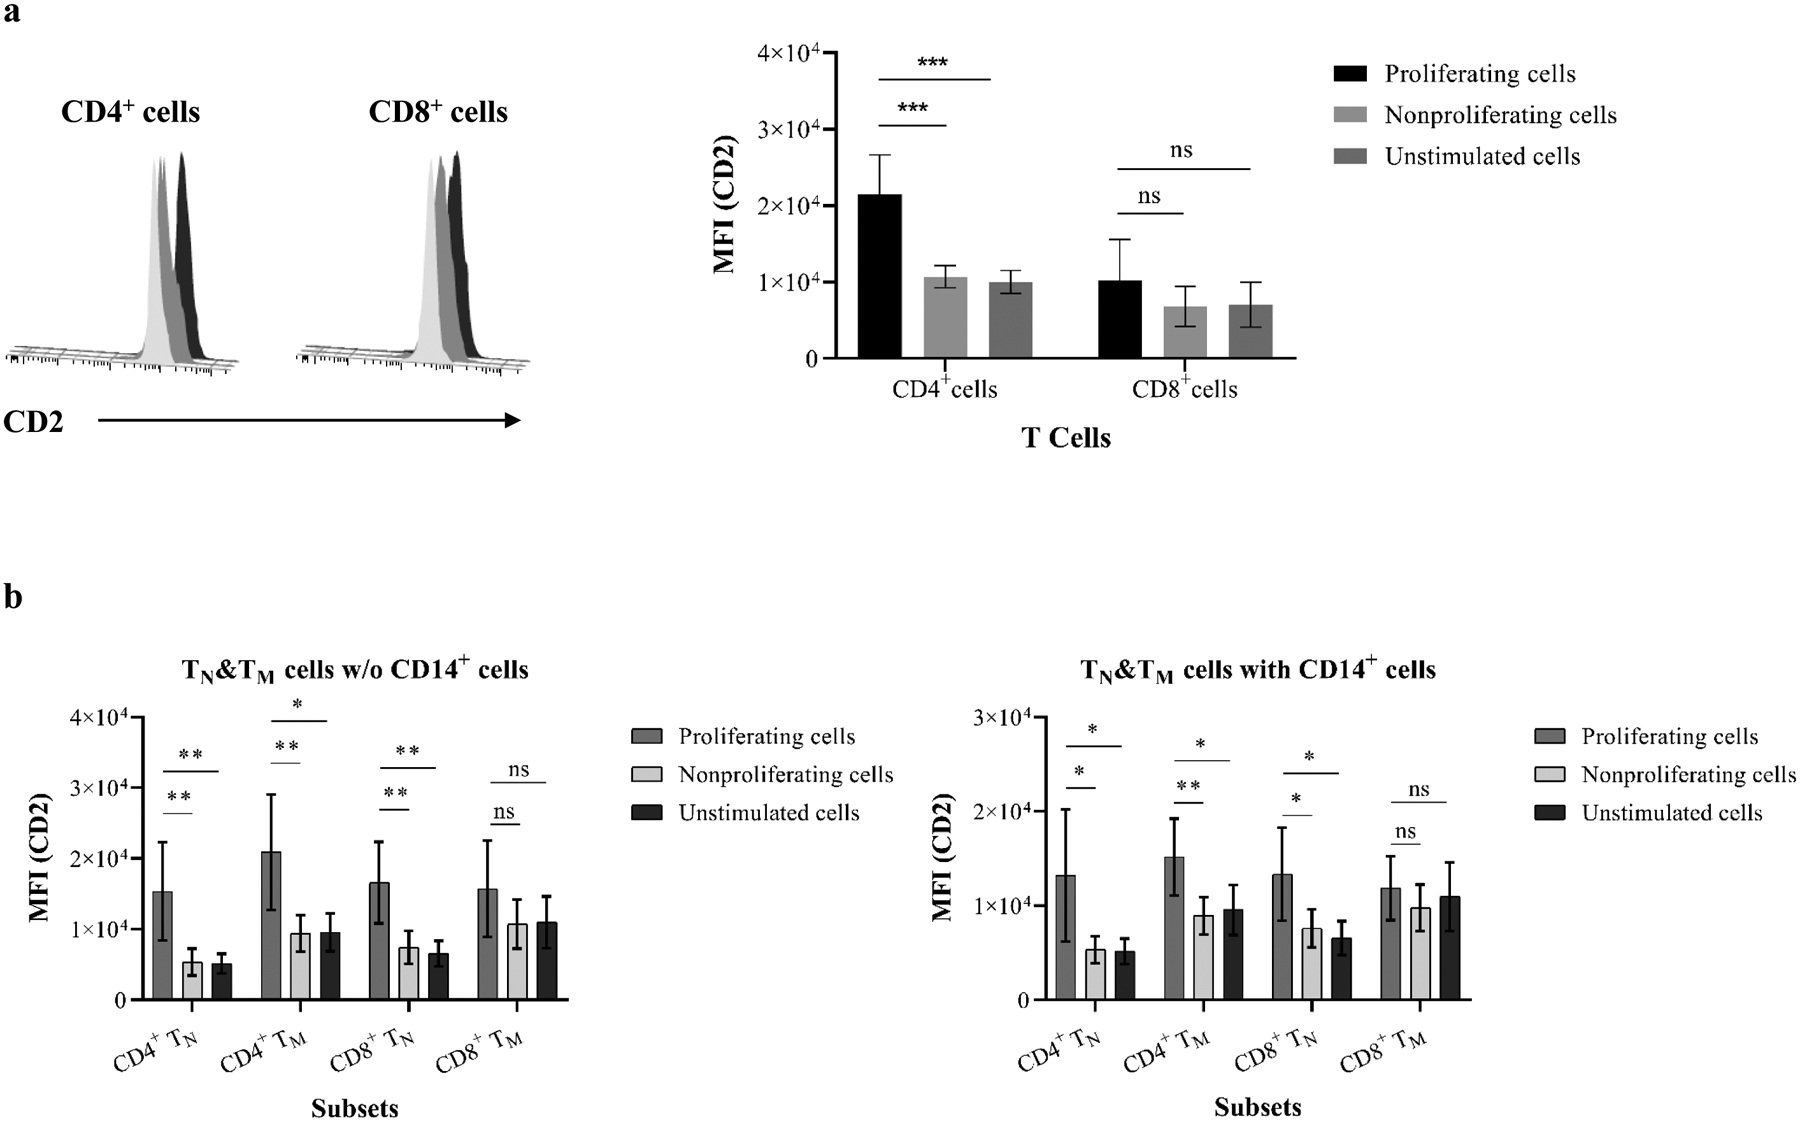
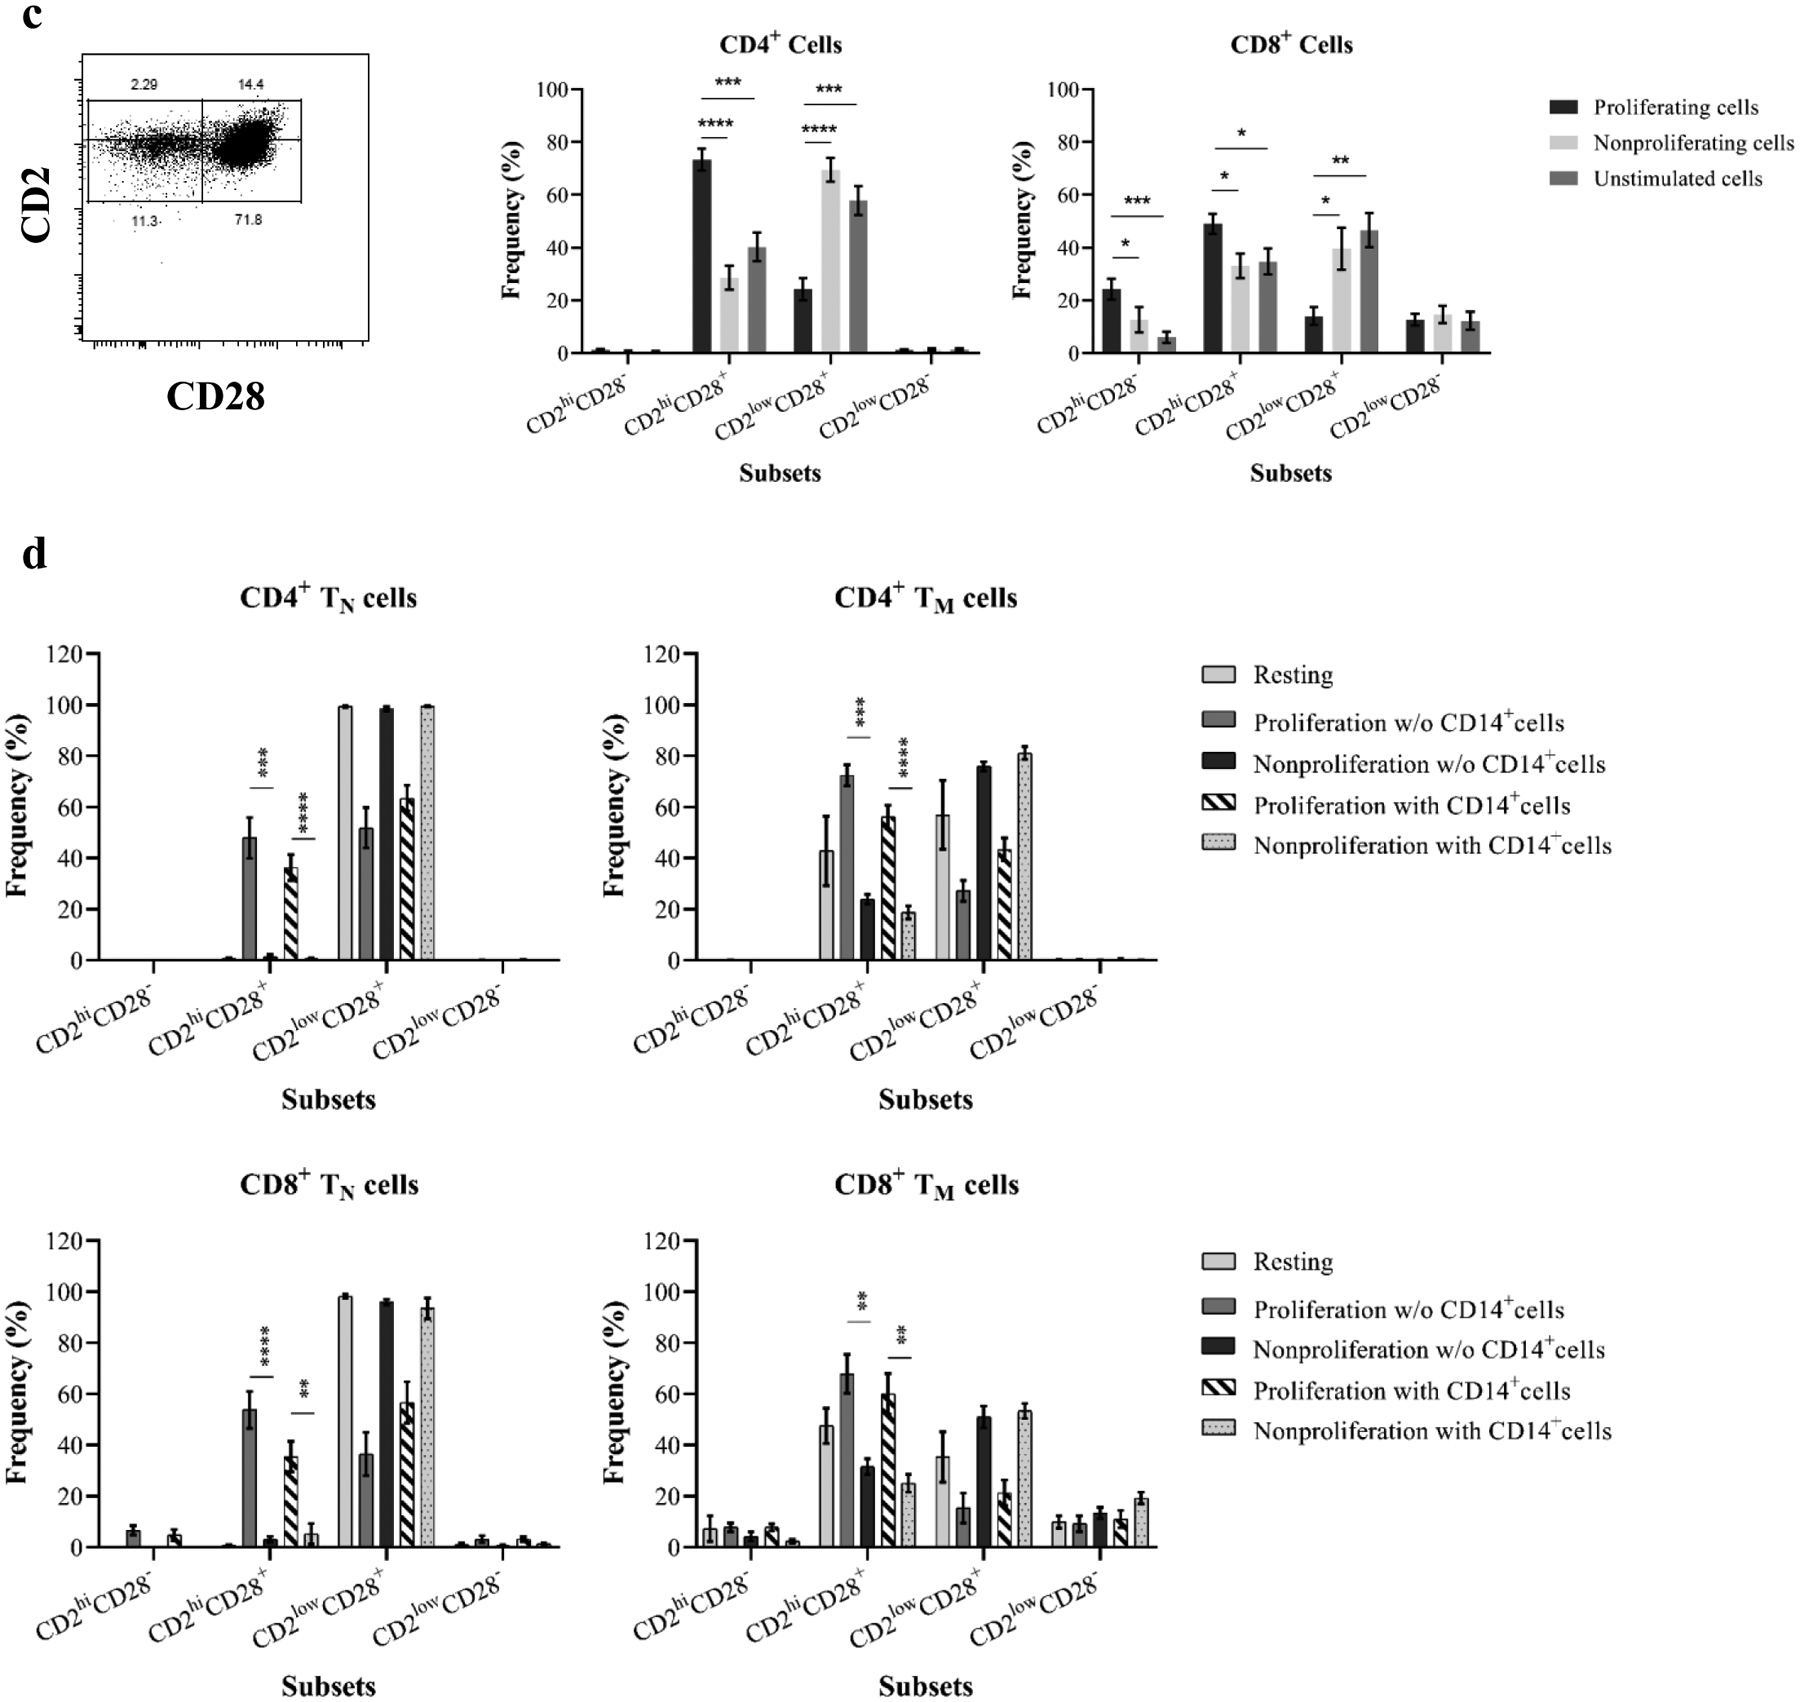
Figure 5. Proliferating xenoreactive T cells upregulate CD2 expression.


(a) PBMCs were analyzed for mean fluorescence intensity (MFI) of CD2 expression following PEC stimulation. Histogram of representative samples (left) shows CD2 MFI on proliferating CD4+ and CD8+ cells (black) when compared with resting (light gray) and nonproliferating (dark gray) cells. The MFI of CD2 on proliferating CD4+ but not CD8+ cells from all tested individuals (right) is significantly higher than resting and nonproliferating cells. (b) Purified naïve and memory cells in the presence or absence of autologous CD14+ monocytes were assessed for MFI of CD2 expression following stimulation with PEC monolayers. (c) CD4+ and CD8+ cells were segregated into four subsets based on surface CD2 and CD28 expression (left). CD4+ proliferating cells show significantly higher levels of CD2hiCD28+ subpopulation when compared with resting and nonproliferating cells. The proliferating CD8+ cells are predominantly CD2hiCD28− and CD2hiCD28+ subsets. (d) Proliferating cells in PEC-stimulated naive and memory cells in the presence or absence of autologous CD14+ monocytes showed increasing frequency of CD2hiCD28+ cells. (* p<0.05, ** p<0.001, *** p<0.0001, ****p<0.00001)
