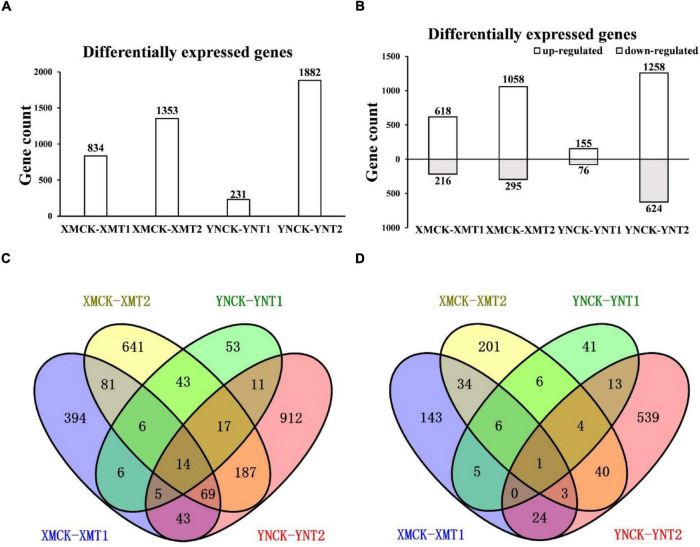
FIGURE 3.
(A) The number of DEGs in each comparison group, (B) The number of upregulated and downregulated DEGs in each comparison group, (C) Venn diagram of upregulated DEGs in each comparison group, and (D) Venn diagram of downregulated DEGs in each comparison group. XMCK, Xinmai26 was treated at 16°C; XMT1, Xinmai26 was treated at 4°C for 4 h; XMT2, Xinmai26 was treated at −4°C for 4 h; YNCK, Yannong19 was treated at 16°C; YNT1, Yannong19 was treated at 4°C for 4 h; YNT2, Yannong19 was treated at −4°C for 4 h.

