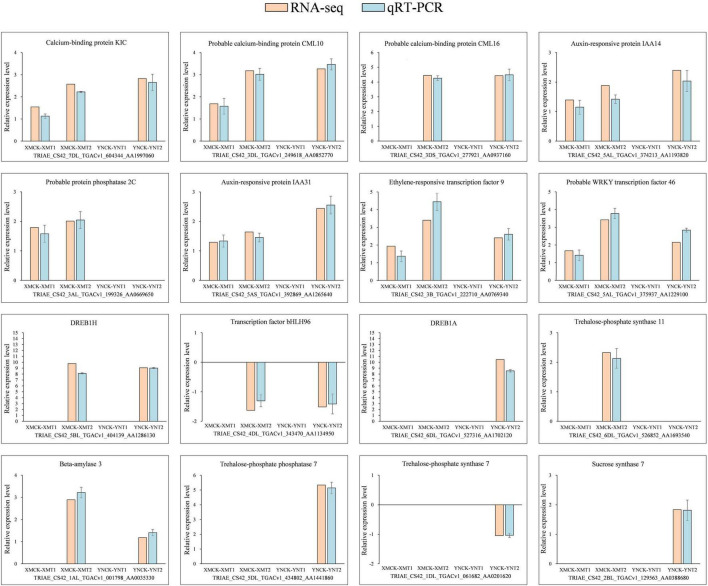
FIGURE 6.
Expression validation of 16 selected DEGs. The relative expression levels of 16 DEGs were determined using qRT-PCR at 4°C and −4°C. There were 14 upregulated genes and two downregulated genes, with three biological replications and three technical replications for each. Relative expression levels were calculated by log2 2–ΔΔCt method and log2FC (RNA-seq). Here, Y-axis indicates relative expression levels and X-axis indicates each comparison group (XMCK-XMT1, XMCK-XMT2, YNCK-YNT1, YNCK-YNT2). An empty histogram indicates either RNA-seq could not detect the gene under this treatment or its expression level was low by | log2(foldchange)| < 1. XMCK, Xinmai26 was treated at 16°C; XMT1, Xinmai26 was treated at 4°C for 4 h; XMT2, Xinmai26 was treated at −4°C for 4 h; YNCK, Yannong19 was treated at 16°C; YNT1, Yannong19 was treated at 4°C for 4 h; YNT2, Yannong19 was treated at −4°C for 4 h.

