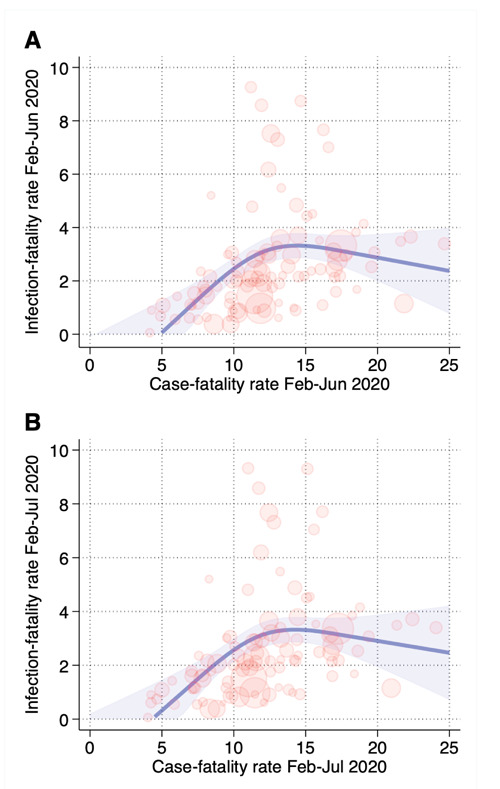
Figure 3.

Comparison of first wave case-fatality rate (using positive swab data to estimate COVID-19 cases) and infection-fatality rate (using May-June seroprevalence data to estimate infected cases) considering the time frames February 24-June 30, 2020 (A) and February 24-July 31, 2020 (B). Spline regression model adjusted for aging index, percentage commuting outside the municipality of residence on a daily basis, and percentage of dwellings occupied by only one resident.
