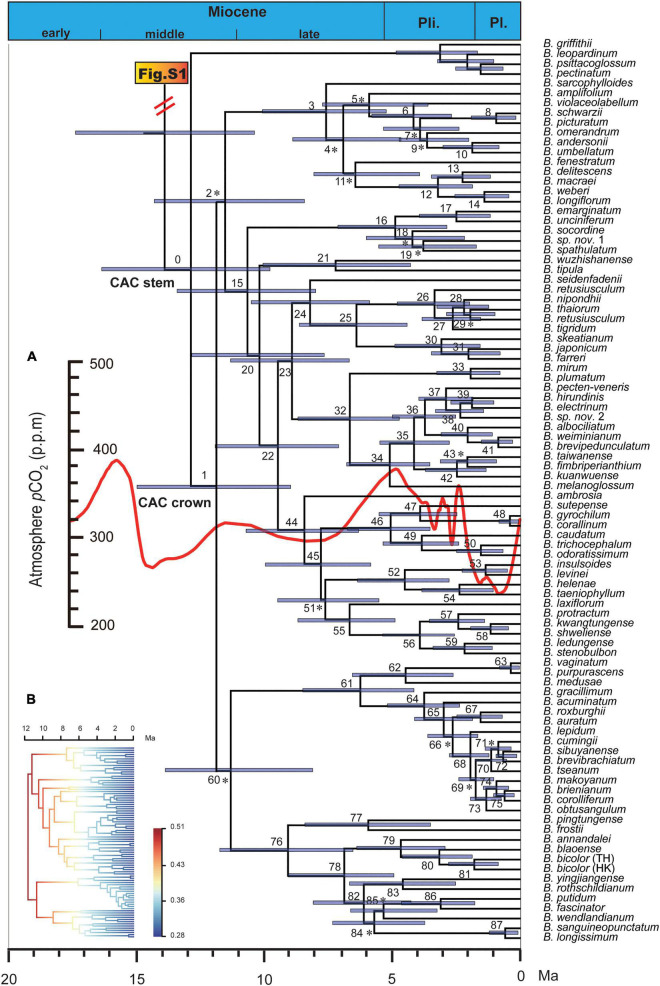
FIGURE 1.
Maximum clade credibility chronogram of the Cirrhopetalum alliance clade (CAC) and its sister group. Asterisk indicates nodes with posterior clade probabilities (PP) < 0.95; otherwise, PP ≥ 0.95. Node numbers correspond with those in Supplementary Table 4. The inserted curve (A) represents estimated mean atmospheric CO2 concentration change based on palaeoclimatic pCO2 data extracted from Foster et al. (2017); the inserted phylorate plot (B) corresponds to the topology of CAC, showing net species diversification rate (lineage/Myr; cool colours = slow, warm = fast). B., Bulbophyllum; Ma, million years ago; Pl., Pleistocene; Pli., Pliocene.

