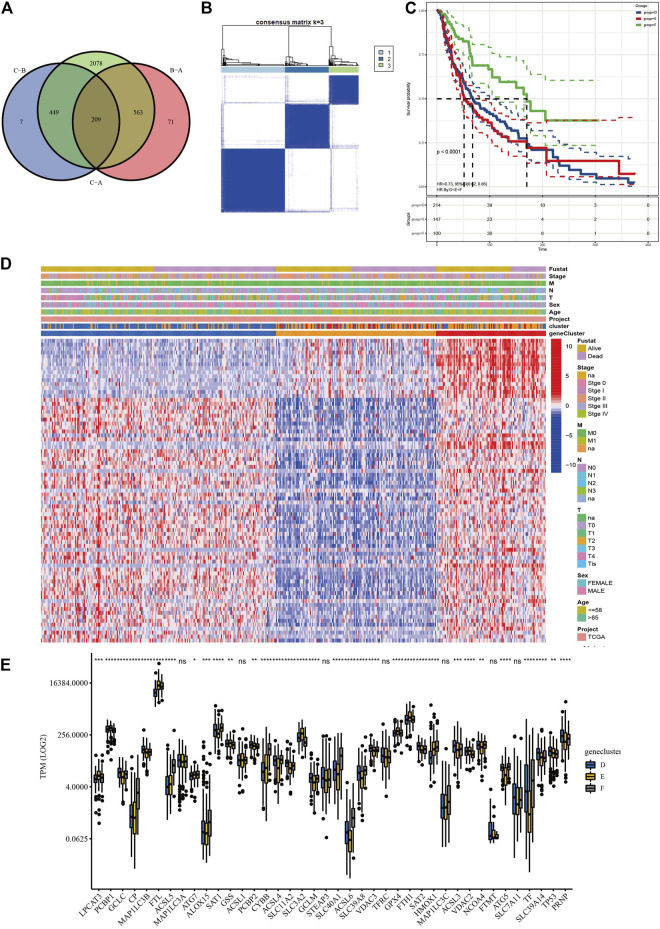
FIGURE 4.
Screening and validation of prognostic lncRNAs. (A) Venn diagram revealed the common differentially expressed lncRNAs (DElncRNAs). (B) Consensus clustering of SKCM patients based on the expression of 77 prognostic long non-coding RNAs (lncRNAs) (k = 3). (C) The overall survival (OS) analysis of SKCM patients in geneclusters D, E, and F, and genecluster F showed the most satisfied prognosis. (D) The heatmap of geneclusters D, E, and F with detailed clinicopathological information, where patients in genecluster F had better prognosis. (E) Significant differences in TPM values of ferroptosis-related genes among the three subgroups (****p < 0.0001; ***p < 0.001; **p < 0.01; *p < 0.05).

