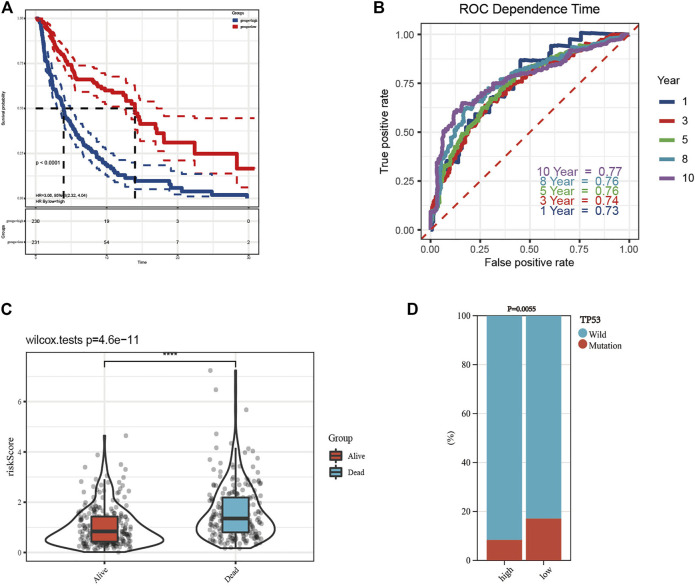
FIGURE 5.
Construction of prognostic model and survival analyses. (A) The Kaplan–Meier (K-M) overall survival curves in the high- and low-risk group. (B) The 1-, 3-, 5-, 8-, and 10-year receiver operating characteristic (ROC) curves of the prognostic model. (C) Risk scores of patients with different survival outcomes were of significant difference. (D) The difference of TP53 mutation state between the high- and low-risk groups was statistically significant.

