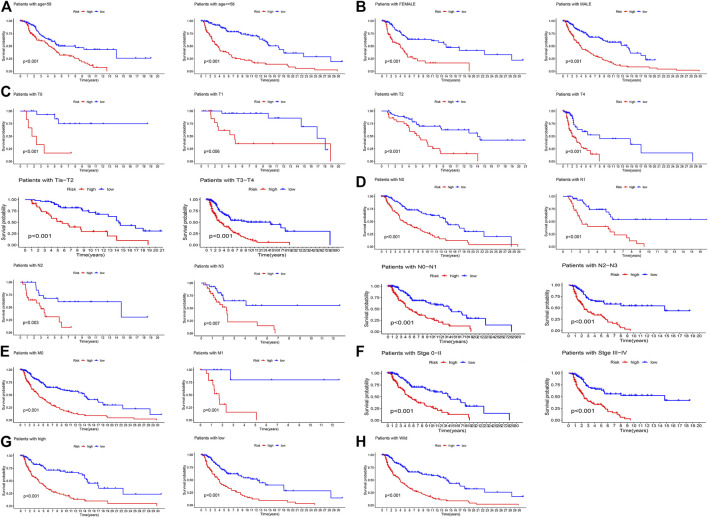
FIGURE 6.
The K-M survival analyses of patients’ clinicopathological stratification between the high- and low-risk groups. (A) Patients >58 or ≤58 years; (B) patients were female or male patients; (C) patients with pathologic T0, T1, T2, T4, Tis-T2, and T3-T4 stages; (D) patients with pathologic N0, N1, N2, N3, N0–N1, and N2–N3 stages; (E) patients with pathologic M0 or M1 stage; (F) patients with tumor 0–II or III–IV stage; (G) patients with high or low expression of TP53; (H) patients with TP53 wild-type.

