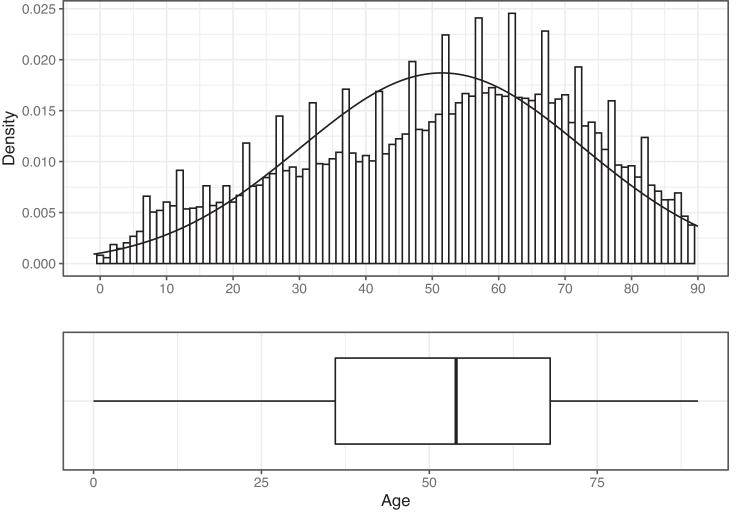
FIG. 3.
Distribution, both histogram and boxplot, of the age (in years) of those hospitalizations for emergency general surgery (EGS). The y-axis of the histogram represents the density (not frequency), and the normal curve for these data is overlaid to highlight the skew in age data for this population.

