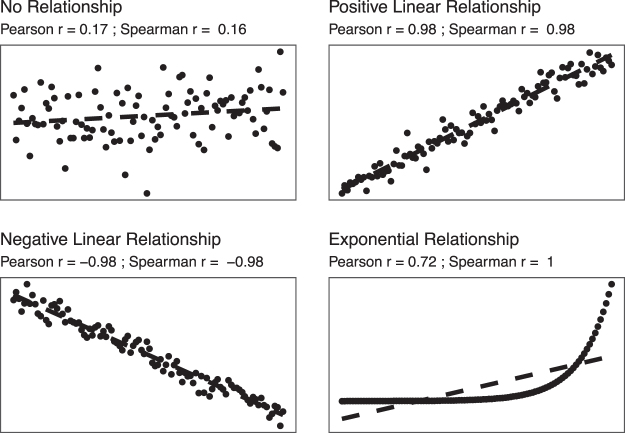
FIG. 1.
Scatterplots showing various correlation strength and direction including no relationship, a positive and negative linear relation, and an exponential relation. Included with each are the Pearson and Spearman correlation coefficients to demonstrate their strength of association as well as direction (positive or negative), and how the Spearman correlation is more appropriate for non-linear relations.

