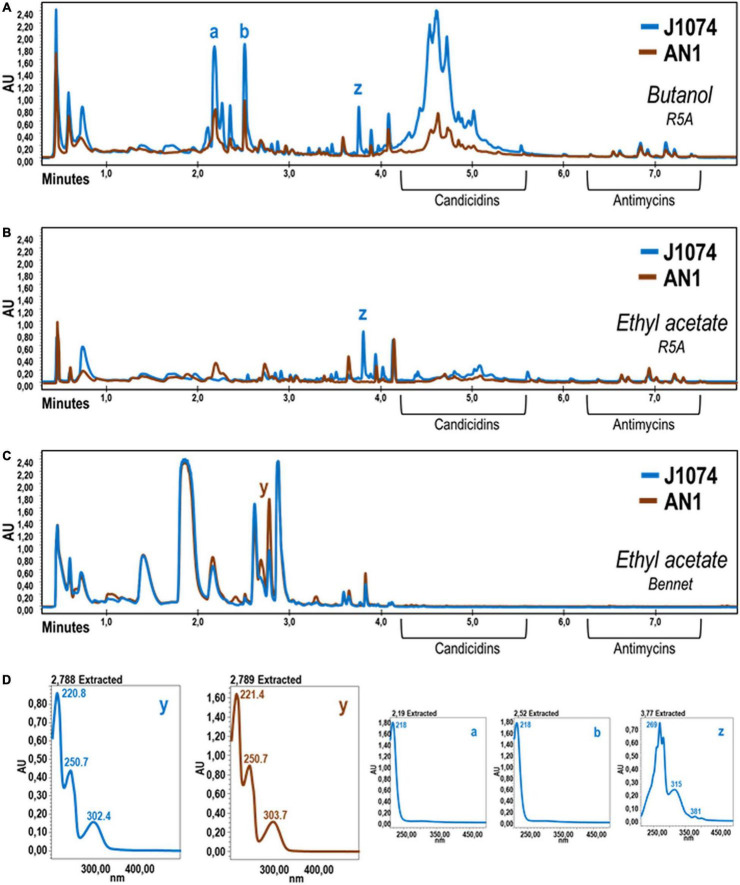
FIGURE 3.
Comparative UPLC chromatograms of cell extracts obtained with several solvents using cultures of S. albus AN1 (brown) and J1074 (blue) in different broths. The two strains were grown in R5A (A,B) or Bennet (C) broth for 96 h and their corresponding metabolites extracted with either 1-butanol (A) or ethyl acetate (B,C). Note that, when both strains are grown in R5A, the candicidins are hardly detected with the ethyl acetate extraction procedure. (D) UV spectra of differential peaks (a, b, y, and z) are shown. UV spectra of peaks a-b and those in between (not shown) were almost identical. These molecules were unable to be dereplicated and therefore no specific activity could be attributed to these putatively unknown molecules.

