
Figure 4.
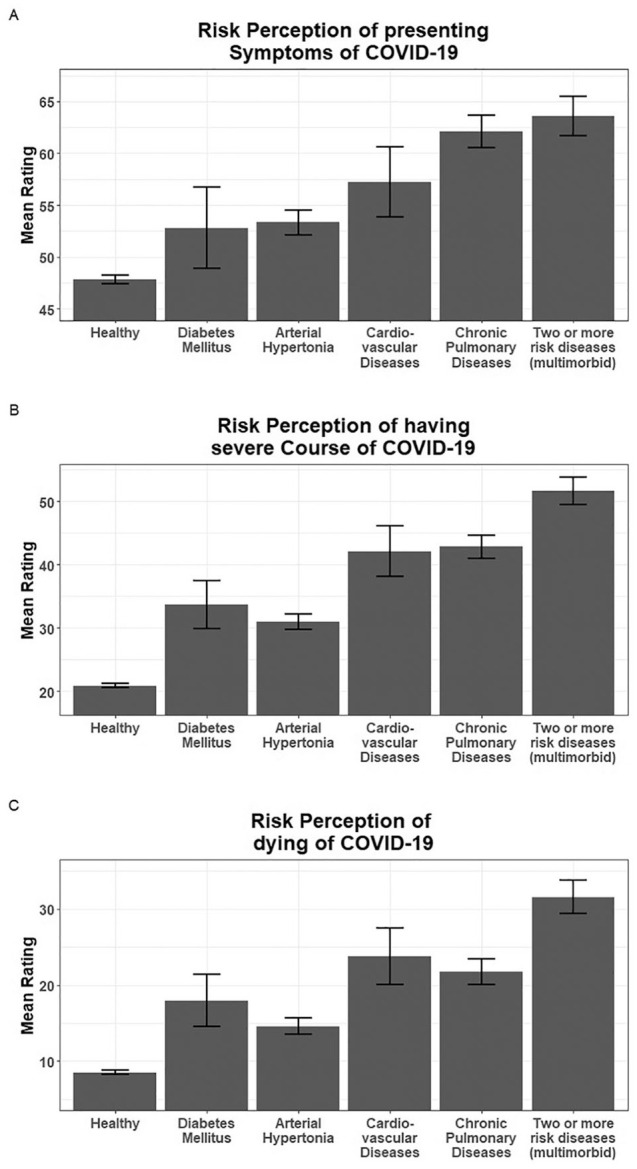
Note. Mean sum score (y-axis) for subjective risk perception of acquire symptoms of COVID-19 (A), have a severe course of COVID-19 (B) and dying on COVID-19 (C) in individuals with a high-risk disease or healthy respondents. The subjective risk perception was recorded in percent (0-100%). Means: eg, healthy: Msymptoms = 47.82, Mcourse = 20.88, Mdeath = 8.49; multimorbid: Msymptoms = 63.6, Mcourse = 51.62, Mdeath = 31.59. Symptoms: F(5,16576) = 123.15, P < .001, η² = 0.036; course: F(5,16576) = 481.67, P < .001, η² = 0.127; death: F(5,16576) = 342.08, P < .001, η² = 0.094.
Please note that these are the means and 95%-CIs computed based on the data as such, not the marginal means and adjusted 95%-CIs of the ANOVAs and the subsequent post-hoc tests.