
Figure 2.
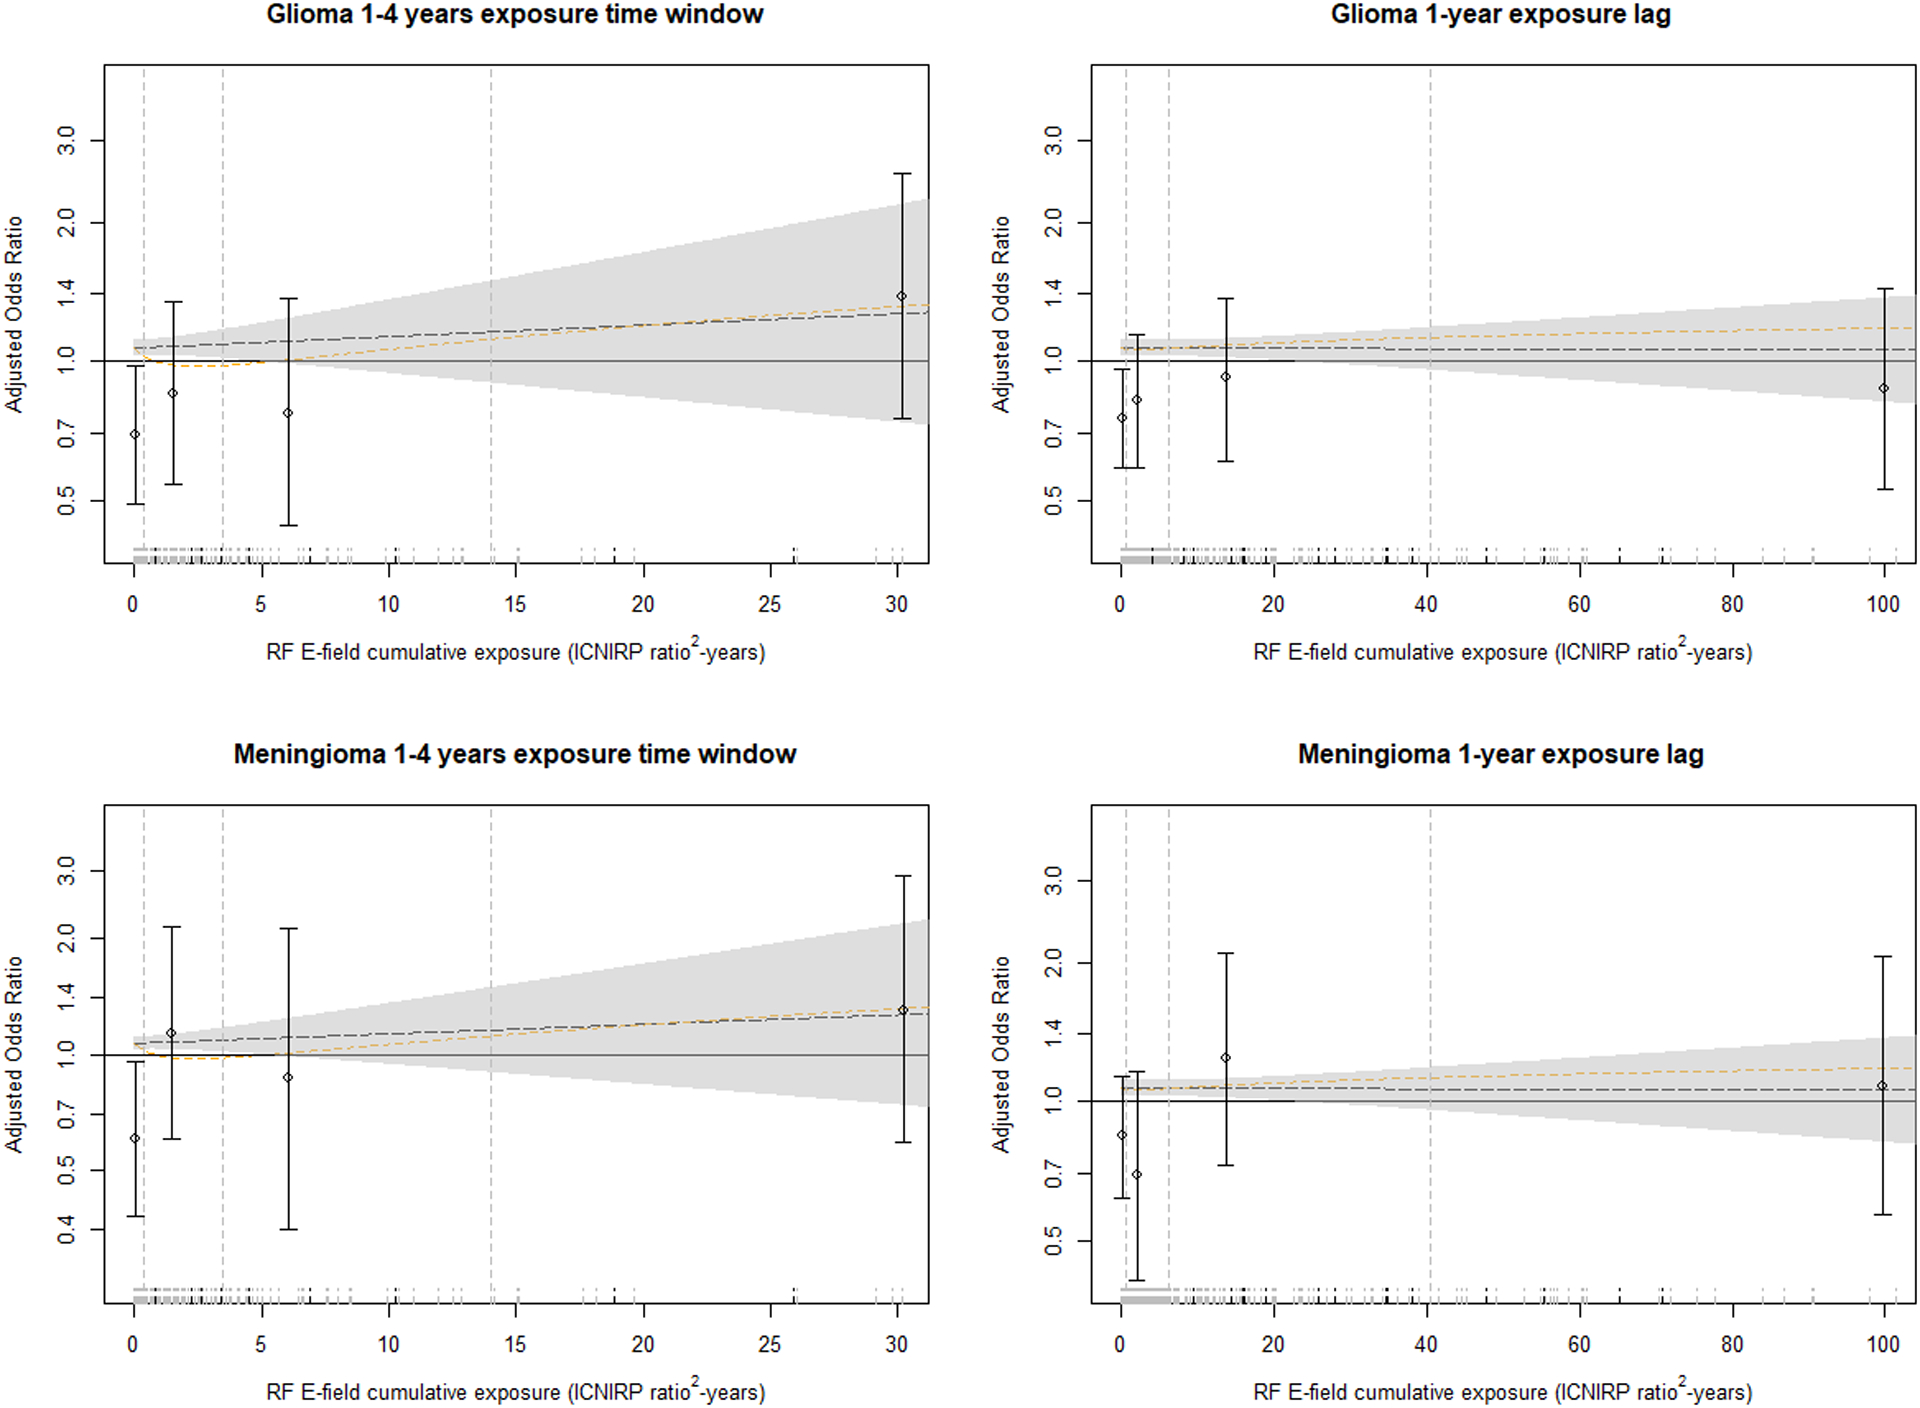
Exposure-response relationship between risk of glioma and meningioma (ORs based on conditional logistic regression models, matched by 5-year age group, sex, country, and region, and adjusted by education) and RF E-field cumulative exposure (ICNIRP ratio2-years) for overall exposure (1-year lag) and 1- to 4-year exposure time window. The dashed lines indicate the linear model (black line) and a quadratic model with log-transformed exposure (yellow line). The grey shadow indicates Wald-type 95% CIs for the linear model. Vertical dashed lines on the left side of the plot indicate the cut points used in the categorical analysis (i.e. 50th, 75th and 90th percentiles of the cumulative exposure distribution of controls). Points and error bars indicate adjusted ORs and Wald-type 95% CIs for the exposure categories based on these cut points. The ORs and CIs from the categorical analysis are positioned at the median exposure for each interval. Plot rug are cases (dashed short vertical black lines) and controls (dashed short vertical grey lines). Plots truncated at the 95th percentile of cumulative exposure to improve visibility.