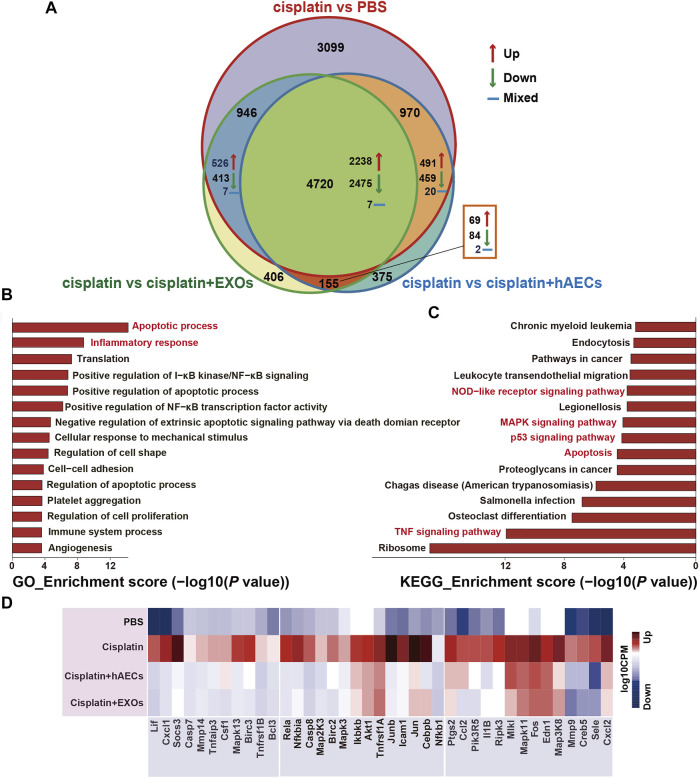
FIGURE 2.
RNA sequencing analysis of kidneys from C57BL/6J mice treated with 15 mg/kg cisplatin. (A) Venn diagram showing the numbers of significant DEGs across the four indicated groups. (B,C) The top 15 enriched GO terms and KEGG pathways of the 2,238 DEGs. (D) Heatmap showing the TNF pathway-related DEGs differentially expressed across the four groups. The colors indicate the value of log10 CPM. CPM, counts per million; cisplatin, Cis-diamminedichloroplatinum (II); DEGs, differentially expressed genes; GO, Gene Ontology; KEGG, Kyoto Encyclopedia of Genes and Genomes.

