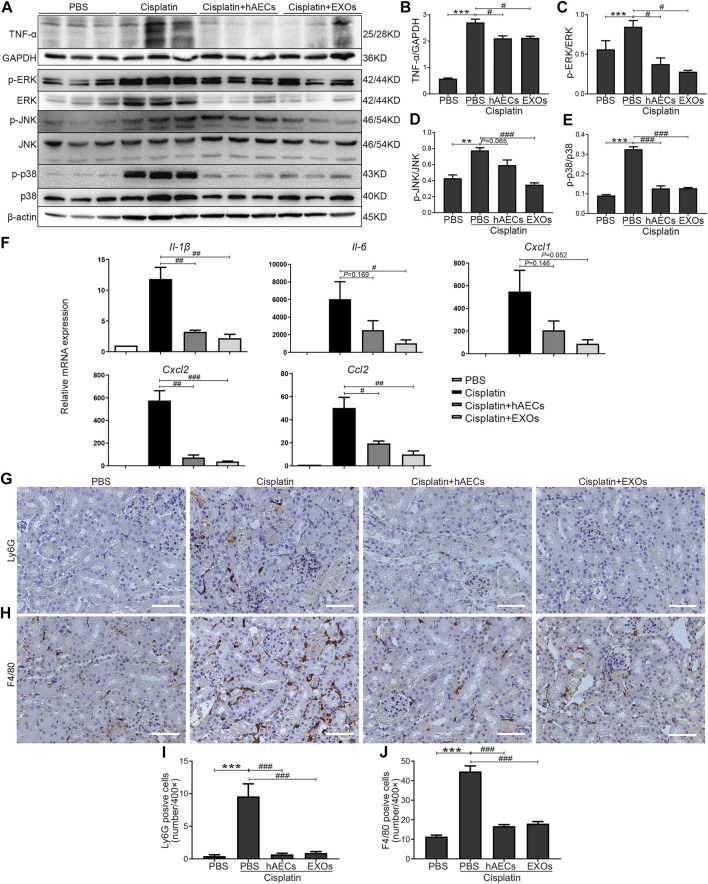
FIGURE 3.
Regulation of TNF-α/MAPK pathway by hAECs and EXOs in C57BL/6J mice treated with 15 mg/kg cisplatin. (A) Representative Western blots showing protein expression of TNF-α, p-ERK, ERK, p-JNK, JNK, p-p38, and p38 of kidneys in different groups as indicated. (B–E) The relative protein expression of TNF-α to GAPDH, p-ERK to ERK, p-JNK to JNK, and p-p38 to p38 in different groups (n = 3). (F) The relative mRNA expression of Il-1β, Il-6, Cxcl1, Cxcl2, and Ccl2 determined by RT-PCR. (G,I) Representative micrographs and quantification of Ly6G positive staining on kidney sections of different groups as indicated. (H,J) Representative micrographs and quantification of F4/80 positive staining on kidney sections of different groups as indicated. Scale bar, 100 μm n = 3 for each group. Data are shown as mean ± SEM. **p < 0.01 and ***p < 0.001 vs. PBS group, #p < 0.05, ##p < 0.01, and ###p < 0.001 vs. cisplatin group.

