FIGURE 6.
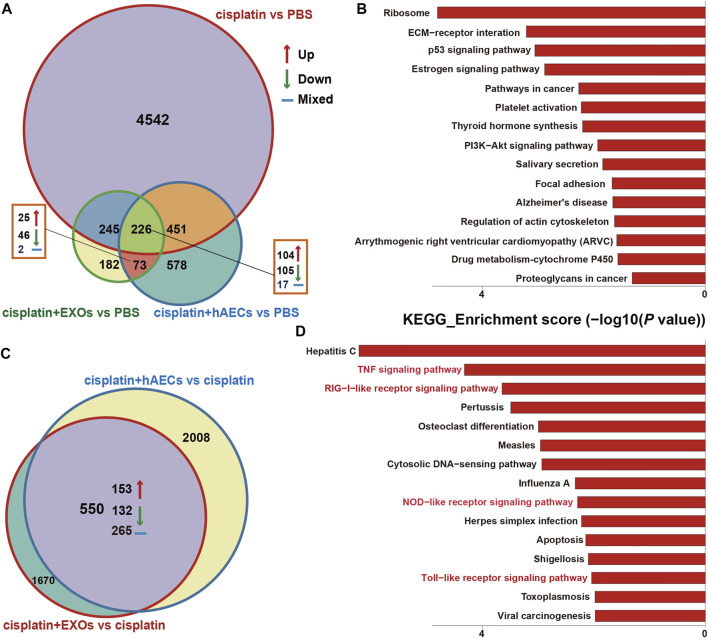
RNA sequencing analysis on tumors from A549 NSCLC nude mice collected 4 days after cisplatin injection. (A) Venn diagram showing the numbers of significant DEGs across the four groups as indicated. (B) The top 15 enriched and upregulated KEGG pathways in the 226 DEGs across the four groups as indicated in (A). (C) Venn diagram showing the numbers of significant DEGs across the two groups as indicated. (D) The top 15 enriched and upregulated KEGG pathways in the 550 DEGs across the four groups as indicated in (C).

