Fig. 1.
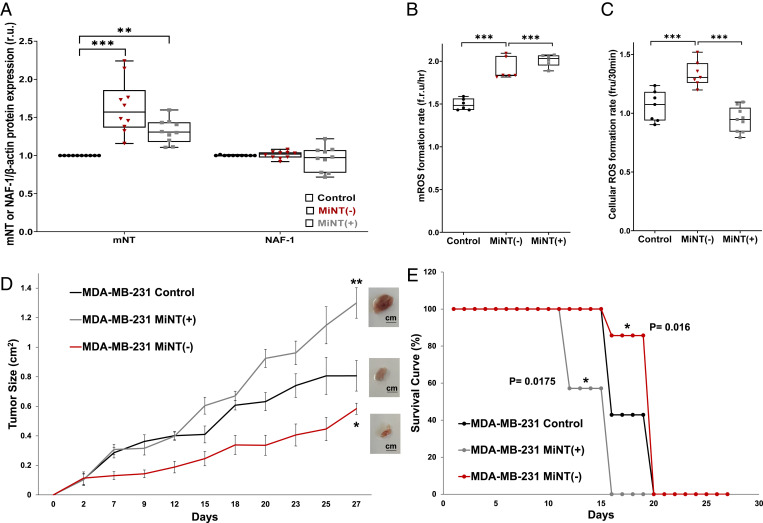
The expression level of MiNT impacts the growth of human xenograft breast cancer tumors. (A) Enhanced expression of mNT protein but not NAF-1 in cancer cells with decreased—MiNT(−) (red dots)—or increased—MiNT(+) (gray dots)—MiNT protein levels; n = 7. (B) The mROS accumulation in MiNT(−) (red dots) and MiNT(+) (gray dots) cells; n = 7. (C) Cytosolic ROS accumulates in MiNT(−) (red dots) but not MiNT(+) (gray dots) cells; n = 7. Results from A–C are presented as box and whisker plots and include all data points measured in three different experiments. *P < 0.05, **P < 0.01, ***P < 0.001; Student’s t test. (D) Xenograft tumor growth (square centimeters) in mice injected subcutaneously with control MDA-MB-231 breast cancer cells (black), or MDA-MB-231 cells with high—MiNT(+) (gray)—or low—MiNT(−) (red)—MiNT expression. (Insets) Images of representative tumors; n = 7. *P < 0.05, **P < 0.01 (day 27). (E) Kaplan–Meier survival curve of mice injected with control MDA-MB-231 breast cancer cells (black), or MDA-MB-231 cells with high—MiNT(+) (gray)—or low—MiNT(−) (red)—MiNT expression; n = 7. Statistical significance was determined using log-rank (Mental–Cox) test to compare MiNT(−) or MiNT(+) to control; *P < 0.05.

