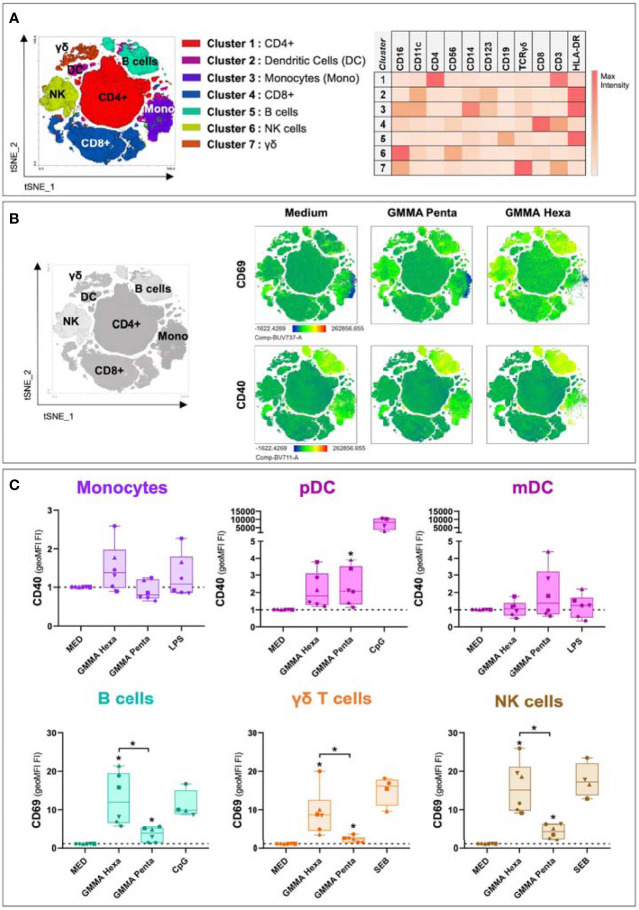
Figure 2.
Flow cytometry analysis for activation marker upregulation in different cell populations after 22 hours of stimulation. (A) t-SNE projection of the FlowSOM clustering results. Clusters were assigned to cellular subpopulations according to the expression profile of specific population markers (right panel). (B) t-SNE plots showing the expression of two different activation markers among different conditions. (C) Upregulation levels of CD40 and CD69 in different cellular populations after hPBMCs stimulation with GMMA Hexa, GMMA Penta and specific positive controls. LPS was used as positive control for monocytes and mDC; CpG for B cells and pDC; and SEB for γδ T cells and NK cells. Marker upregulation is expressed as fold increase (FI) of the geoMFI with respect to negative control (MED). Dotted lines indicate the reference value of 1 for the control samples. The different dots represent the six different donors. Significance was estimated using the paired Wilcoxon test (*p < 0.05). Significant differences with respect to the negative control are indicated on top of each box, instead significant differences among stimuli are shown explicitly. Non-significant differences are not shown.

