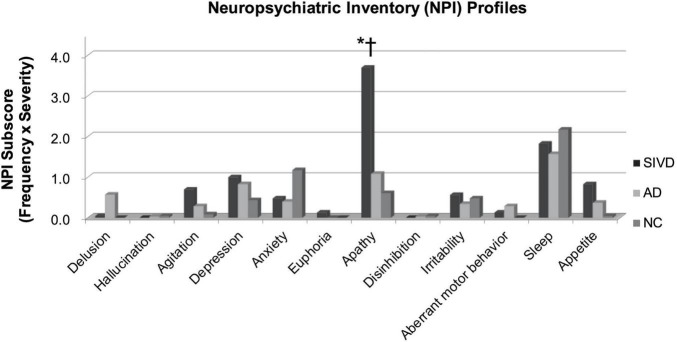
FIGURE 2.
Comparisons of neuropsychiatric symptoms. SIVD, Subcortical ischemic vascular disease; AD, Alzheimer’s disease; NC, Normal Cognition. Comparisons were made by using the Analysis of variance (ANOVA). P-values < 0.05 resulting from post hoc Tukey analyses were as follows: *: between SIVD and AD, †: between SIVD and NC.

