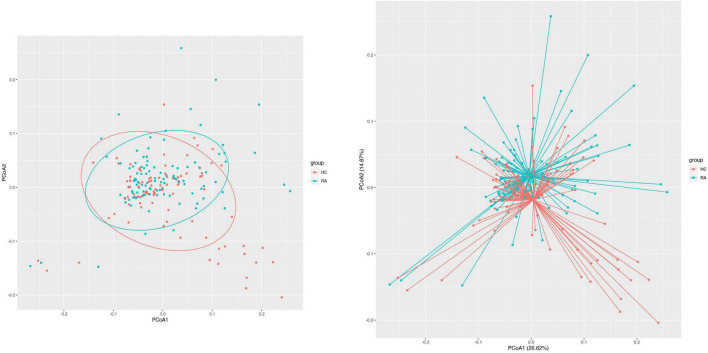
FIGURE 2.
β Diversity of the gut microbiome in RA patients and HCs. Principal coordinate analysis plot generated from the weighted UniFrac analyze. The x and y axes represent the first and second coordinates, respectively; and values in parentheses show the percentage of the community variation explained by each coordinate. Blue and red symbols represent bacteria in the RA and control groups, respectively.

