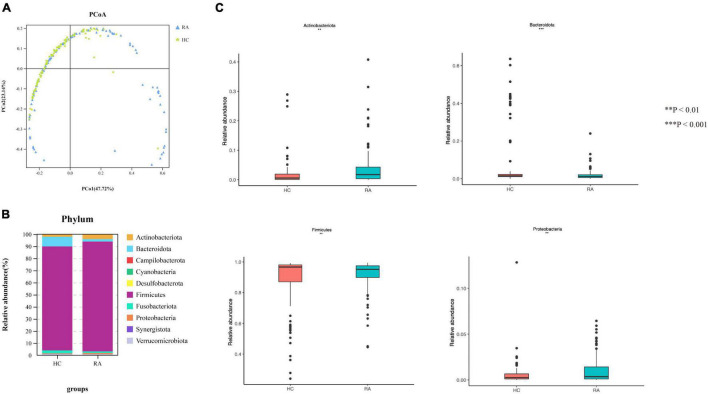
FIGURE 4.
Microbiota community composition of RA patients at the phylum level. (A) Principal coordinate analysis plots at the phylum level for RA patients and HCs. The x and y axes represent the first and second coordinates, respectively, and values in parentheses show the percentages of the community variation explained by each coordinate. Blue and green symbols represent bacterial phyla in the RA and control groups, respectively. (B) Relative abundance of phyla in all subjects and in each group. (C) Phylum-level comparison of the relative abundance of gut microbiota between RA patients and HCs. *P < 0.05, **P < 0.01, ****P < 0.001.

