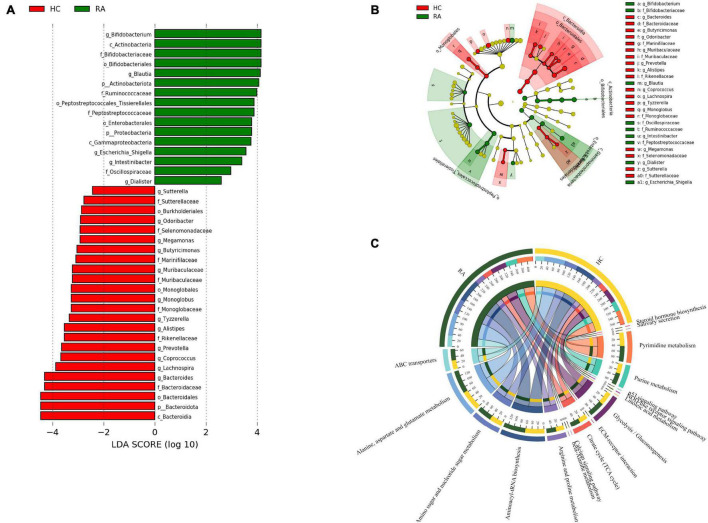
FIGURE 7.
Patients with RA characterized by expansion of rare microbial lineages. (A,B) LEfSe analysis was performed to identify differentially abundant taxa, which are highlighted on the phylogenetic tree in cladogram format (A) and for which the linear discriminant analysis scores are shown (B). Red and green colors indicate an increase or decrease in taxa, respectively, in RA patients compared to HCs. (C) KEGG pathways significantly enriched in RA patients compared to HCs.

