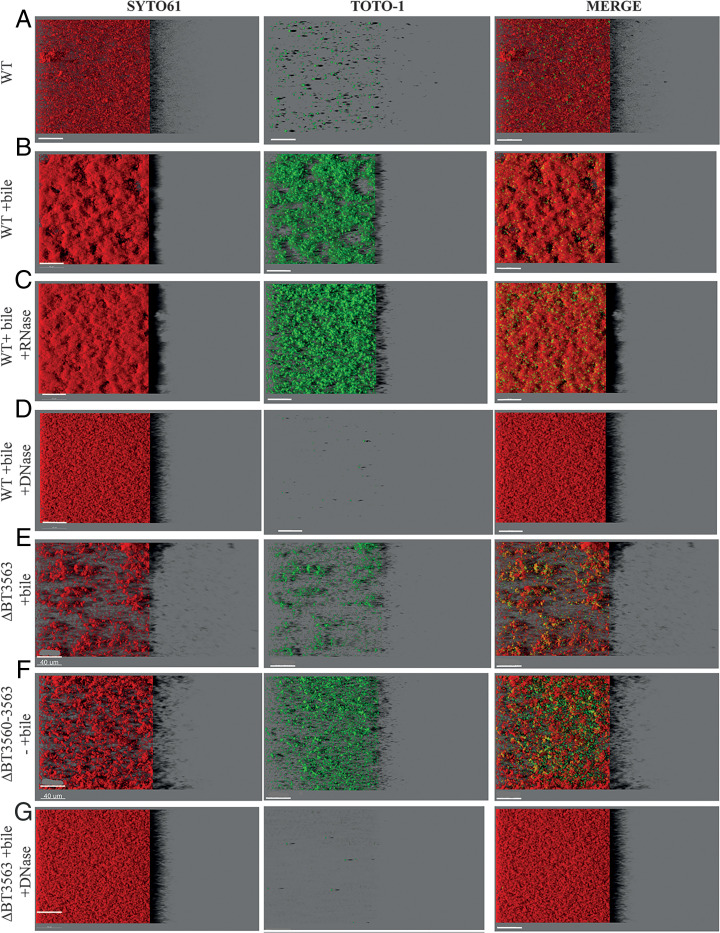
Fig. 4.
(A–G) Visualization of B. thetaiotaomicron biofilms. IMARIS easy 3D projections from CLSM images of B. thetaiotaomicron biofilms grown in plates in the absence or presence of 0.5% bile extract (“+bile”), RNase I (“+RNase”), or DNase I (“+DNase”). Cells are labeled with SYTO61 dye (Left, in red). eDNA and dead cells are labeled with TOTO-1 (Middle, in green). The merged image is shown on the Right. For each image, the virtual shadow projection of the biofilm is shown on the Right. (Scale bars, 40 µm.)

