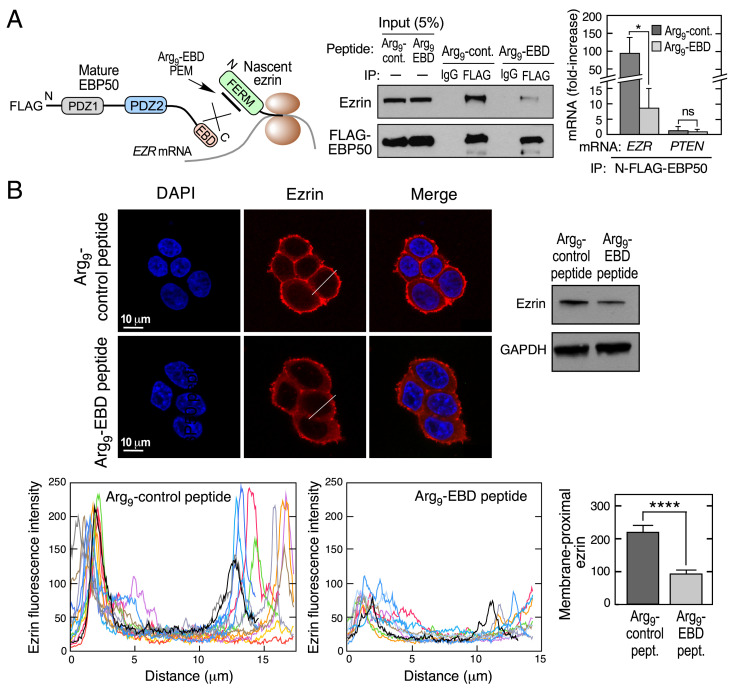
Fig. 4.
Peptide mimetic of EBD abrogates cotranslational interaction of EBP50 with ezrin. (A) Schematic depicting inhibitory activity of EBD mimetic peptide (Left). HEK293T cells were transfected with N-FLAG- EBP50 and then treated with Arg9-EBD or control peptides, and subjected to immunoprecipitation with anti-FLAG and isotype-specific IgG antibodies (Center). HEK293T cells were transfected with same EBP50 constructs and lysates subjected to anti-FLAG RIP-qRT-PCR with probes targeting EZR or PTEN mRNA (Right). mRNA is expressed as fold-enrichment compared to isotype-specific IgG RIP-qRT-PCR. Mean + SD, n = 3; *P < 0.05; ns, not significant. (B) Influence of EBD peptide mimetic on ezrin expression and localization. Analysis of HEK293T cells were treated with Arg9-EBD or control peptides. Ezrin localization was detected by Immunofluorescence using anti-ezrin antibodies (Upper, Left), and expression determined by immunoblot (Upper, Right). Line plots showing ezrin localization in cells treated with Arg9-EBD or control peptides (n = 10 cells, Lower, Left two panels). Bar graph reports peak maximum fluorescence intensities at membrane-proximal regions; mean + SD; n = 10 cells; ****P < 0.001 (Lower, Right).

