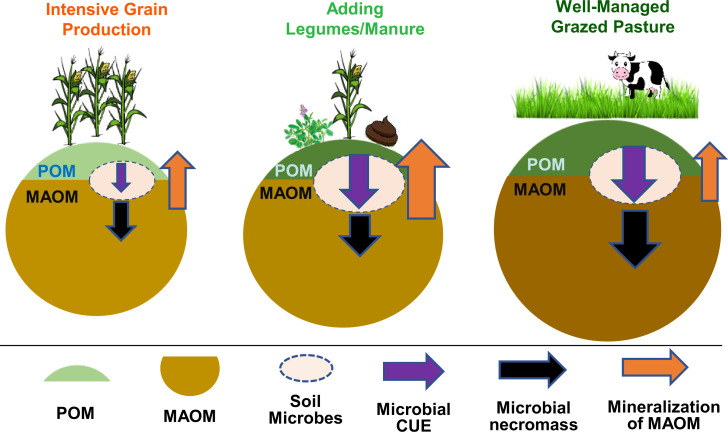
Fig. 4.
Conceptual model of how agricultural systems affect microbially regulated SOM dynamics. The size of the POM, persistent MAOM, and soil microbes within each circle indicate the relative sizes of C pools. Different colors of labile organic matter fractions indicate the quality of C input (light green = higher C:N ratio of labile fractions, dark green = lower C:N ratio of labile fractions). CUE, microbial biomass production/C assimilated. The size of arrows indicates the relative magnitude of C fluxes. Adding legume cover or forage crops and/or adding manure in the systems supply higher-quality C input (reflected by lower C:N ratio of the POM), which increases microbial CUE and necromass production. However, the oxidative loss of MAOM induced by tillage or nutrient requirement (mostly from maize) results in a faster mineralization of MAOM. As a result, only the rotationally grazed pasture systems led to meaningful C accrual.

