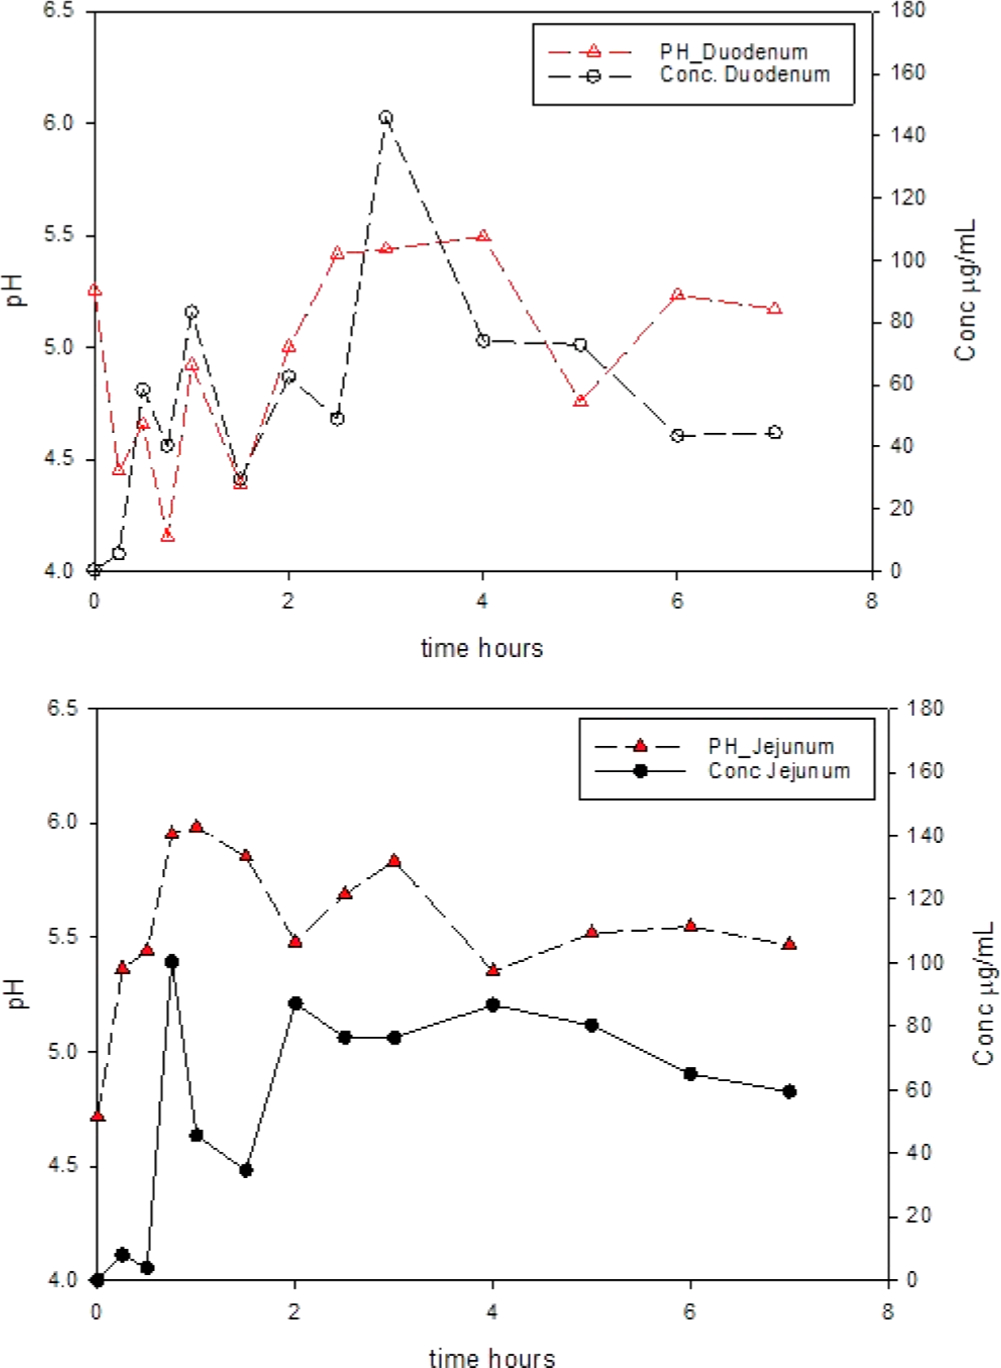
Figure 3.

Average pH values (mean values across 19 data sets at each time point) in the duodenum (top) and jejunum (bottom) as a function of time (h) and average duodenal (top) and jejunal (bottom) ibuprofen solution concentrations (μg/mL) versus time.
