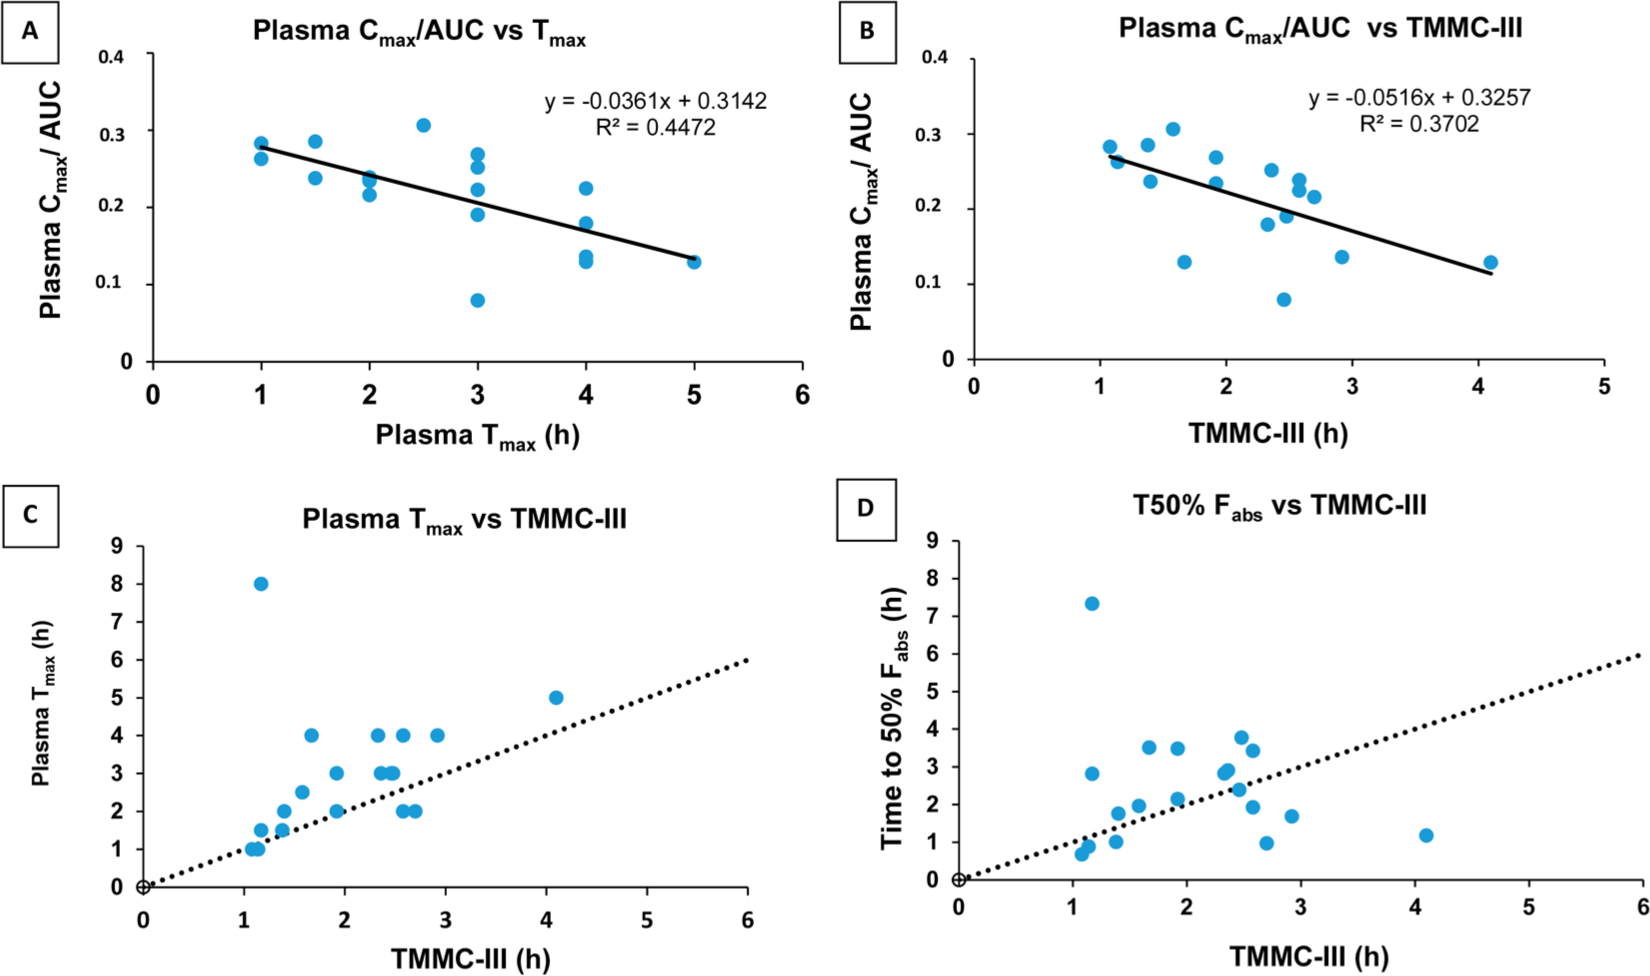
Figure 7.

Exploratory data analysis. Top plots: Correlations between plasma Cmax (corrected by AUC) and (A) Tmax and (B) the time to the next phase III contractions postdose (TMMC-III). Bottom plots: (C) Correlation between plasma Tmax and the TMMC-III. (D) Correlation between time to 50% fraction absorbed and the TMMC-III. The dotted line in plots C and D corresponds to the identity line.
