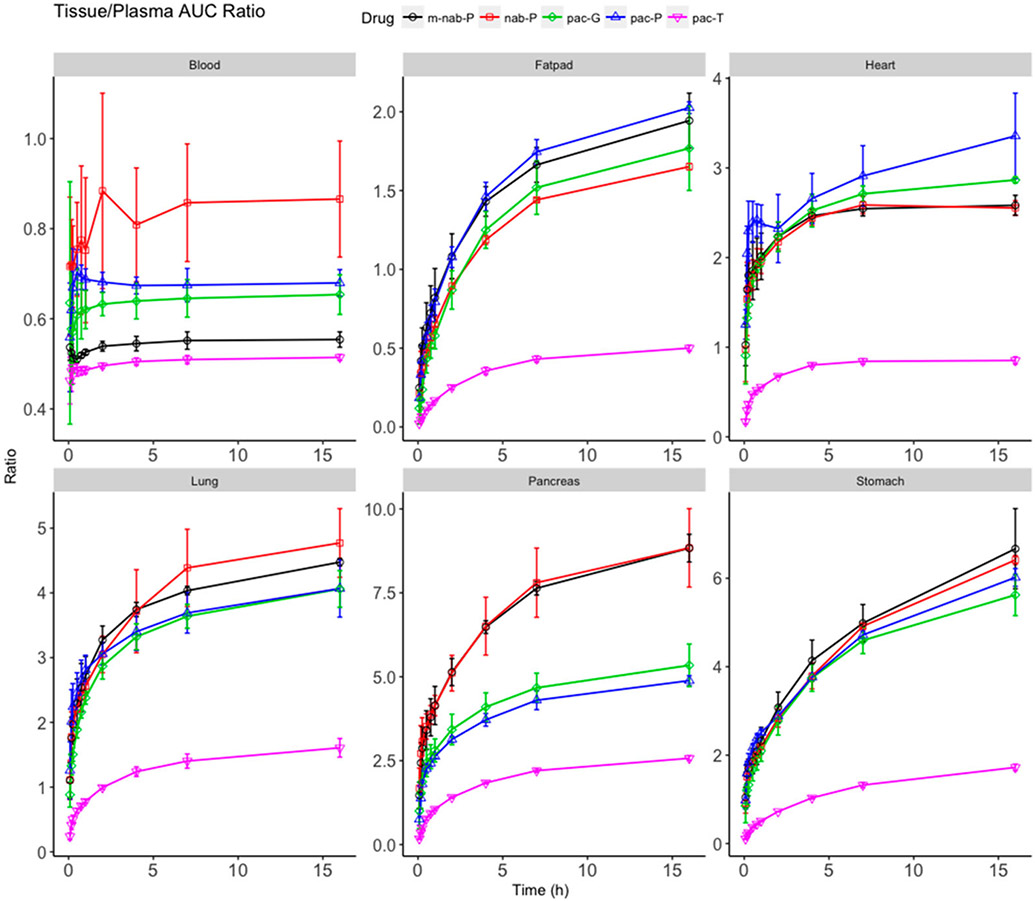
Figure 5.
Ratio of area under the curve (AUC0-t) between select tissues (blood, fat pad, heart, lung, pancreas, and stomach) and plasma. Ratio (y-axis) of accumulated AUC in tissues scaled to its corresponding accumulated AUC of plasma for solvent-based paclitaxel (pac-T), nab-paclitaxel (nab-P), mouse albumin nab-paclitaxel (m-nab-P), micellar paclitaxel (pac-P), and polymeric nanoparticle paclitaxel (pac-G).

