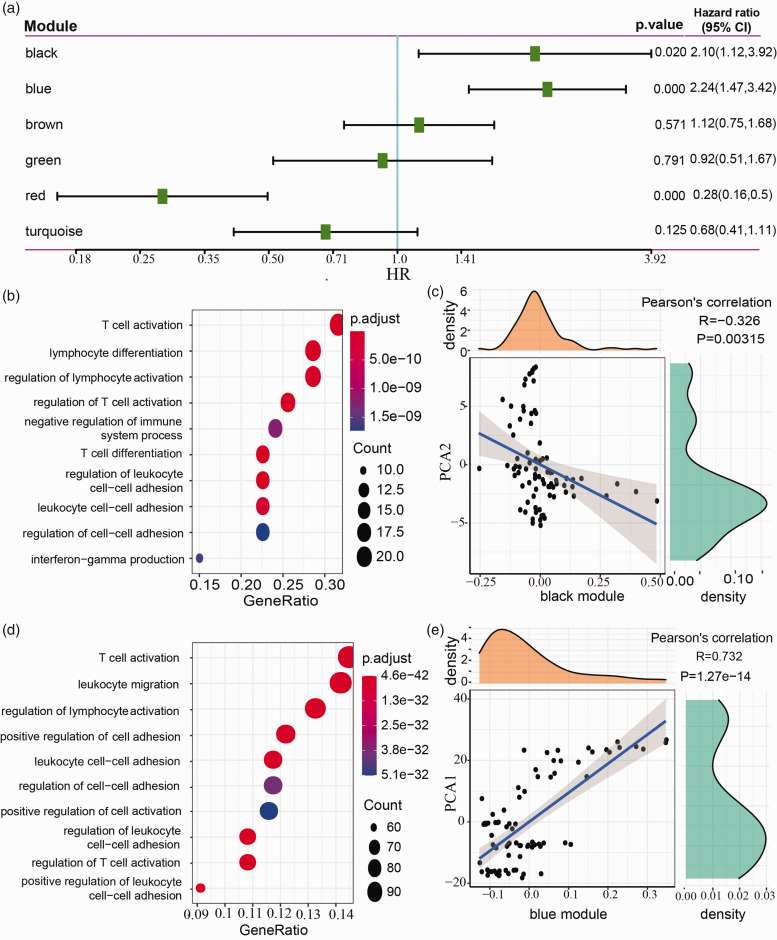
Figure 10.
Function analysis of black and blue modules. (a) Univariate Cox regression analysis of six modules. (b) Functional enrichment analysis of black module. (c) The correlation between black module eigengenes and the component 2 of immune landscape (PCA2). (d) Functional enrichment analysis of blue module. (e) The correlation between blue module eigengenes and the component 1 of immune landscape (PCA1). (A color version of this figure is available in the online journal.)
HR: hazard ratio; CI: confidence interval.

